From one point of view every recession looks different. There were deflationary recessions and hyperinflationary recessions which led some to posit that regular old inflation was incompatible with recessions. When their suppositions were proved incorrect we got the term stagflation and a host of new explanations mostly based on what we hadn’t yet seen. After a few more it was near universally agreed that what we definitely hadn’t seen was a broad recession cause by declining housing prices, another example of noticing a truth causing it to be no longer true. So we can have hyperinflation, deflation, stagflation, bubbles in abstract goods (the tech bubble) or solid goods (the housing bubble).
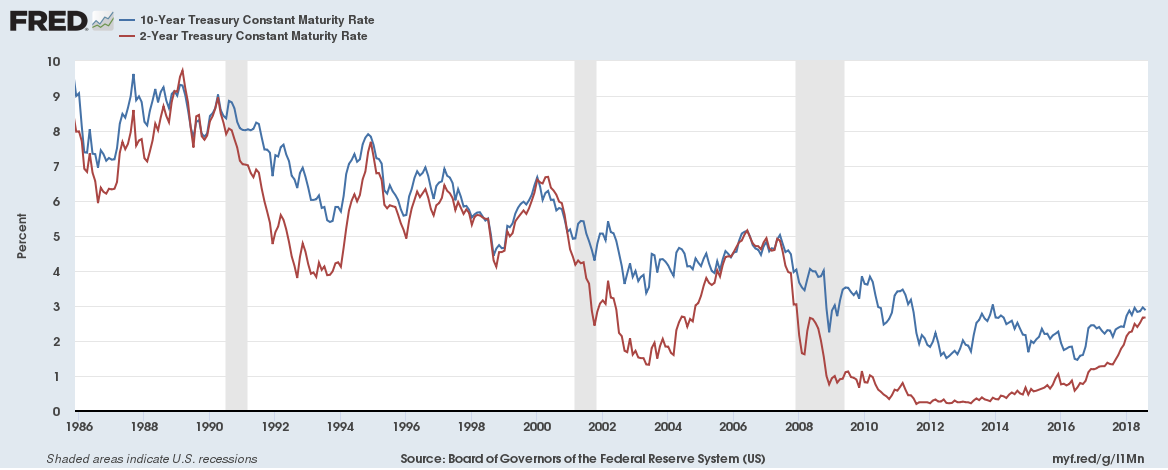
On the other hand, at least recently, recessions seem to have some similarities. The 10 year minus 2 year yield curve (YC) has inverted before each of the last 5 recessions in the US. In each of the last 3 recessions the yield curve reverted before the official beginning of the recession, and each of those events saw market prices reach their absolute peaks after the inversion of the YC.
There are four basic possibilities when two things appear to be strongly correlated, with our example it could be that the recessions was causing the yield curve inversion (unlikely since the inversion occurs first, and sometimes reverts before the recession), it could be that the inversion causes the recession, it could be that both have the same cause or it could just be a coincidence that will disappear in the future (I am disregarding this one for now at my own peril).
So let us take a look at the inverted yield curve. First off it makes no economic sense for the curve to ever invert, because the curve is about lending to the same entity. If the government defaults on its debt in the next two years this will affect both holders of 2 year treasuries and 10 year treasuries, so any risk that is built into the 2 year is built into the 10 year. The 10 year bond can have risk that the 2 year doesn’t, any risk that might rear its head between year 2 and year 10 wouldn’t impact the 2 year return, but would the 10. Likewise opportunity cost favors the 2 year bond, if another, better looking investment opportunity comes along you are more likely to be able to take advantage of it without other costs if you hold a 2 vs a 10 year note.
Functionally you see this in practice. 15 year mortgage rates are lower than 30 year mortgage rates, using FRED data we can see (going back to 1992, when their data starts) that the 15 year rate never exceeds the 30 year rate, this is what you would expect from a reasonably rational market.

This is not an artifact of looking at the longer end of the curve as the 30 year Treasury minus 10 year Treasury was also inverted before each of the last two recessions. This gives us a clue, rates that are (more) market based don’t invert even in the face of major financial issues in the economy. I would say this makes it likely that the cause of YC inversion lies in non market participants, be it the Fed or the Federal government.
Now an inversion could occur one of two ways, either the shorter term rate rises faster than the longer term rate or the longer term rate drops faster than the shorter term rate.
Here we see in each of the last 3 inversions the short rate has risen faster (this is also true for the previous two recessions but the graphs are far harder to read on those longer timescales). It is also true that each time that the YC reverted it did so with the shorter term rate falling faster than the long term rate.
There is in the data set one false positive, with a brief inversion in 1998, this did not shortly preceed a recession. This is also the only one where the inversion came with the long term rate falling faster than the short term rate.
If we take what is generally accepted, that the Federal Reserve controls (or has more influence over) the short end of the curve we have our culprit. We can feel fairly confident of this particularly because the short rate falls to cause the reversion. If the long rate bounced up to cause the reversion it might be that the Fed was simply ahead of the markets sometimes, or some other explanation, given the Fed is basically always raising rates into the inversion followed by lowering I am calling this capitulation by the Fed.
Now we know that the Fed has a dual mandate, full employment and price stability.
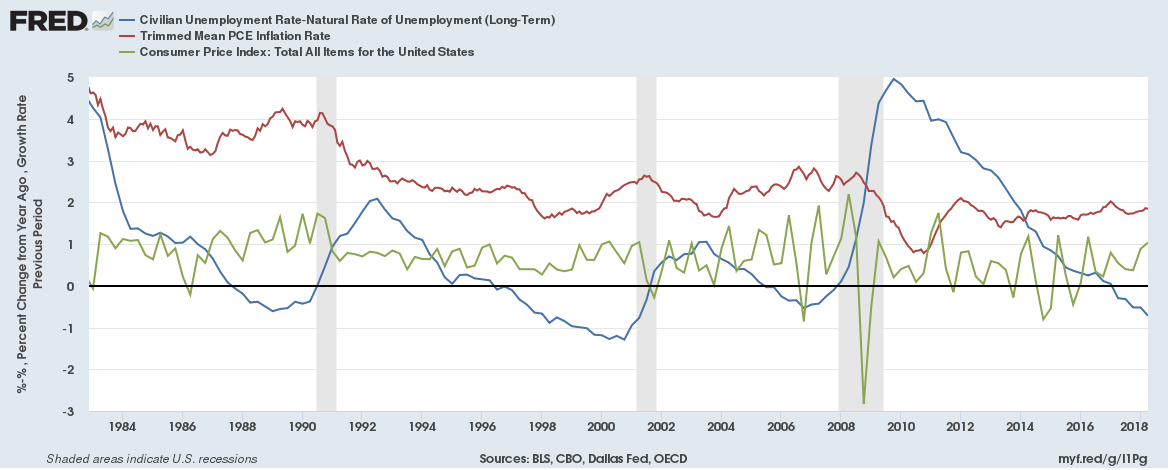
This graph is a little busy, so a brief description is in order. The blue line is the employment rate that the Fed cares about the most, it is the unemployment rate (UE) minus the Natural Rate of unemployment (NRUE), full employment is when this line is at zero, and in an ideal Fed world is where it would always be. The red and green line are different inflation measures.
What I think is of note in this graph is the lack of any inflation driver that would have convinced the Fed to raise rates in any of the events leading up to the inverted yield curve. A couple of better looks with the YC and the inflation measures together.
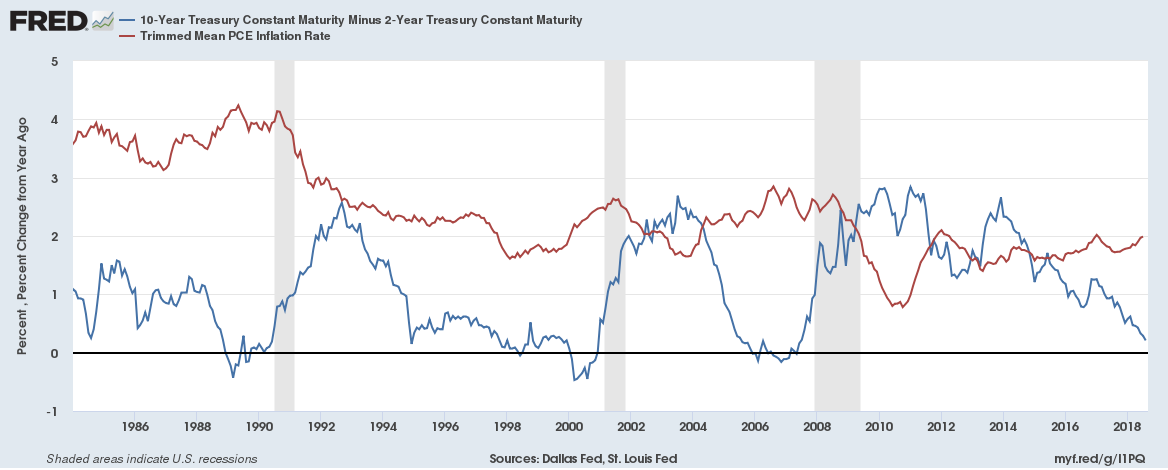

So two final graphs to wrap this portion up
First
The YC vs UE - NRUE
It appears that UE-NRUE leads the YC into its inversions
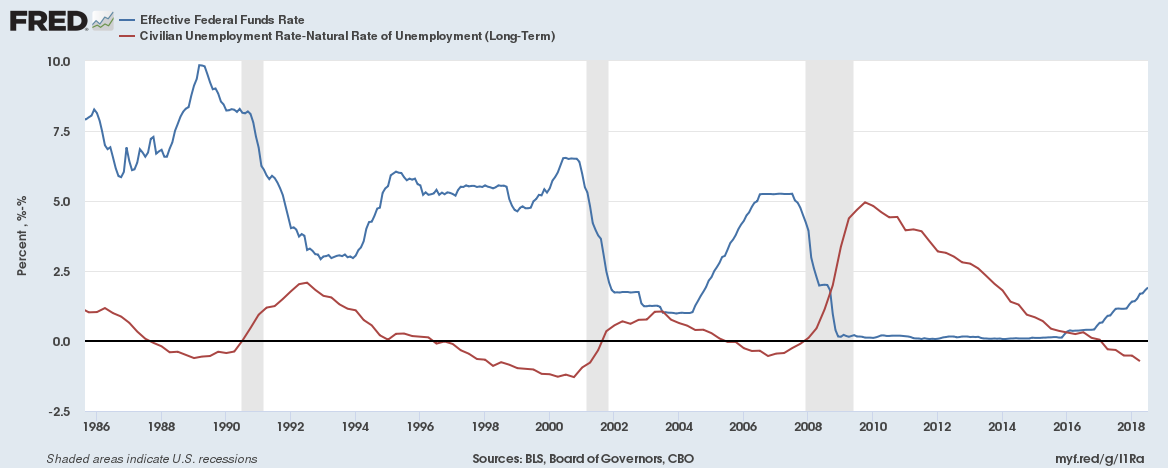
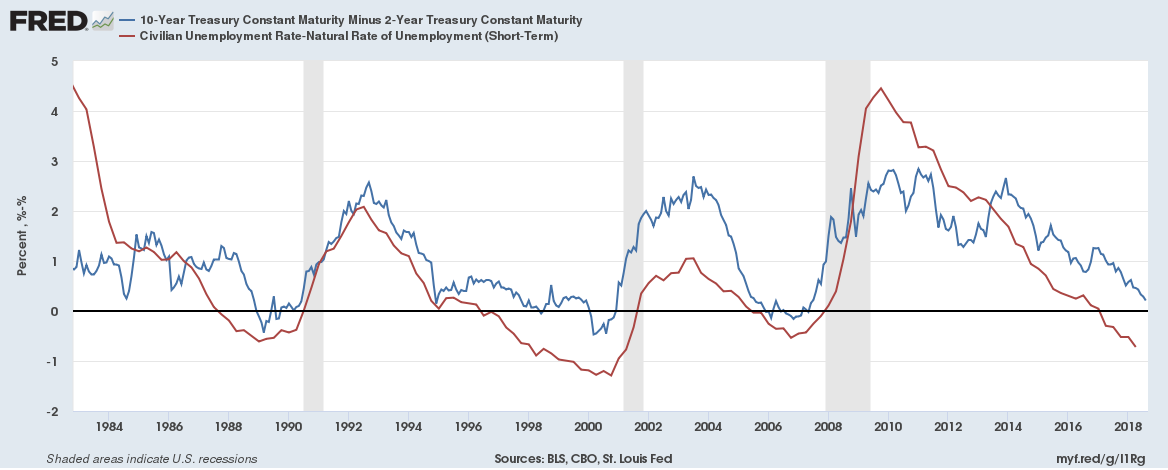
The Federal Funds rate vs UE-NRUE
Here is the interesting stuff. In theory the Fed stimulates the economy by lowering the Federal Funds rate. This is supposed to increase borrowing in turn increasing investment which in turn increases employment. The flip side is also supposedly true, the Fed raises rates to slow down an overheating economy and reduces employment. This graph shows that the opposite is basically occuring. There is a natural objection here, that the Fed reacts to the market and they raise rates when UE is to low already, and lower rates when it gets to high. I do not think this is a satisfactory explanation. In 1989 when the funds rate starts dropping the economy is supposedly above full employment, it doesn’t get to the “ideal” line of full employment until the start of the recession. The same thing occurs in 2000 and 2007, and one interpretation of this is that the Fed’s one measure of a healthy economy doesn’t occur until a recession hits.
No comments:
Post a Comment