Friday, September 28, 2018

Inverted Yeild Curve as a casual agent

Late in a post about the yield curve David Beckworth has a quote that is almost a throwaway line

An inverted yield curve means smaller net interest margins for financial firms and thus less financial intermediation. That is, once the yield curve inverts, it goes from being a predictive tool to a causal agent.

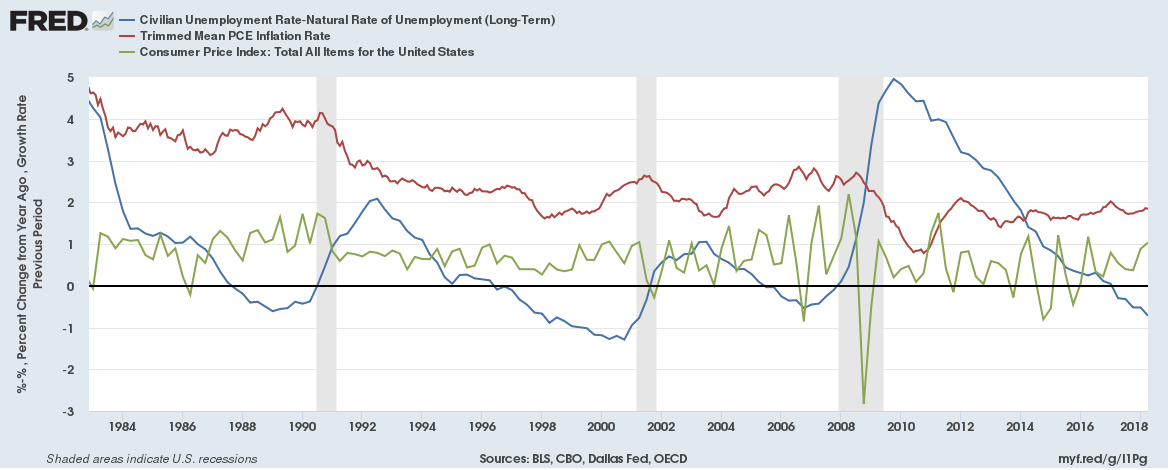
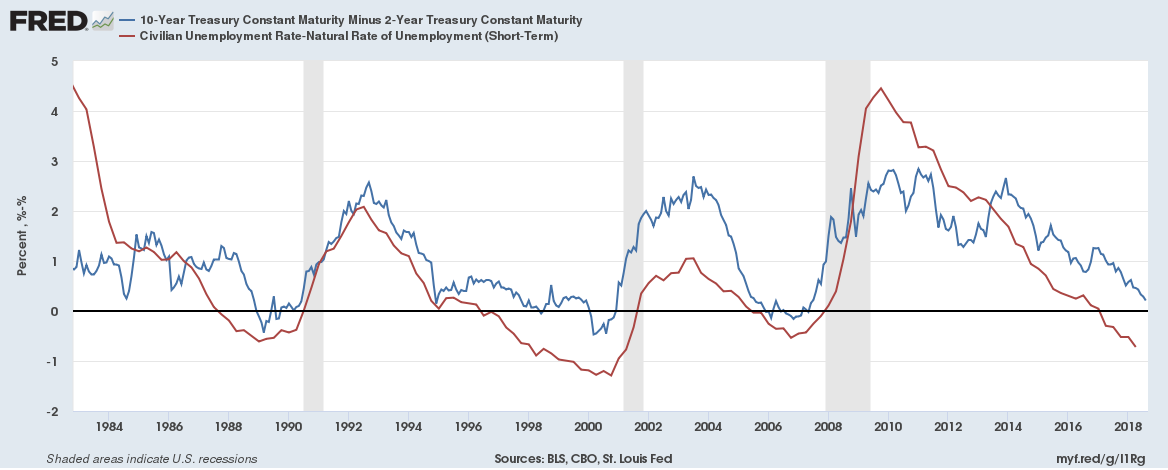
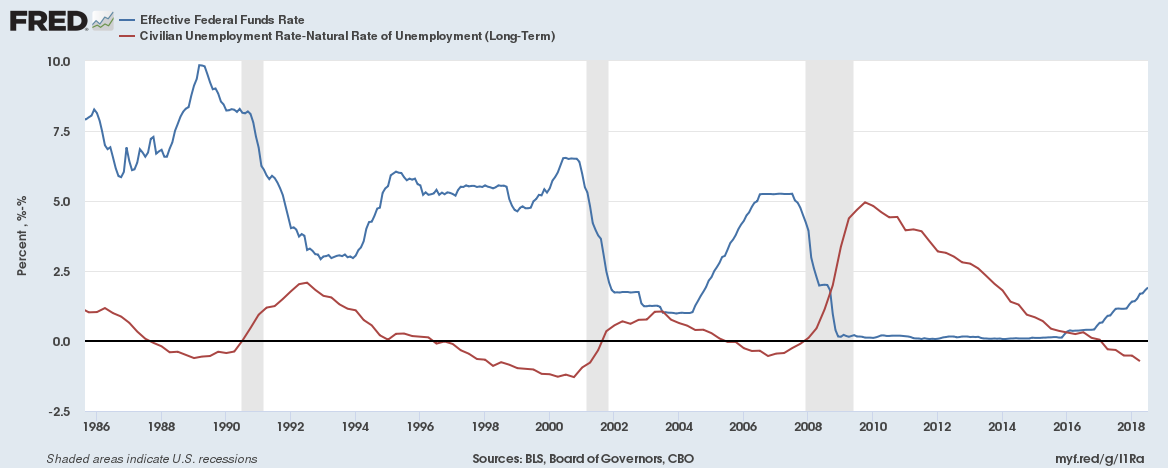
 There is a problem with this statement, it is hard to square with the actual economic outcomes.  For example the UE rate tends to drop or remain at low levels while the yield curve is inverted (UE rate is divided by 2 in these graphs to make it easier on the eyes).


The 2000 recession


And the early 1990s recession


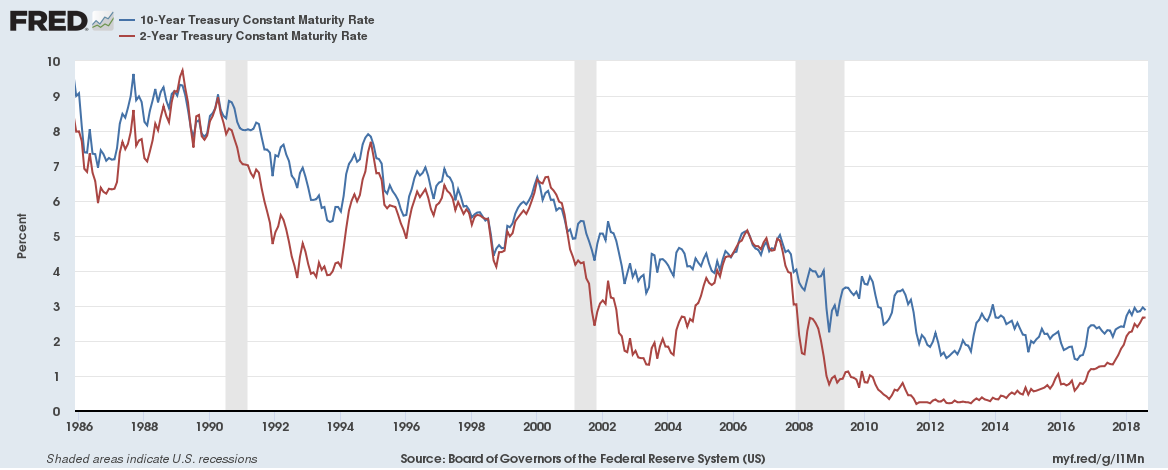
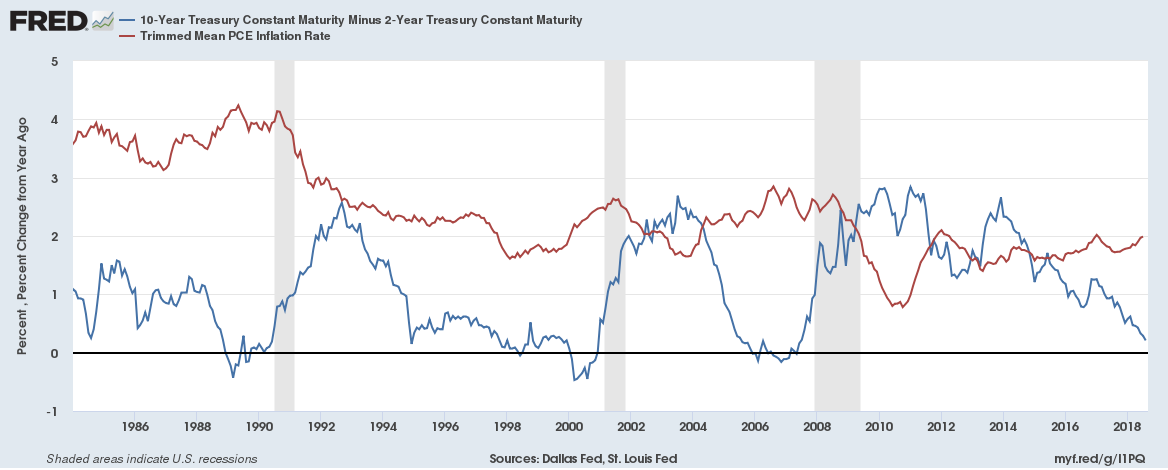
Nor does the market show fears of a recession


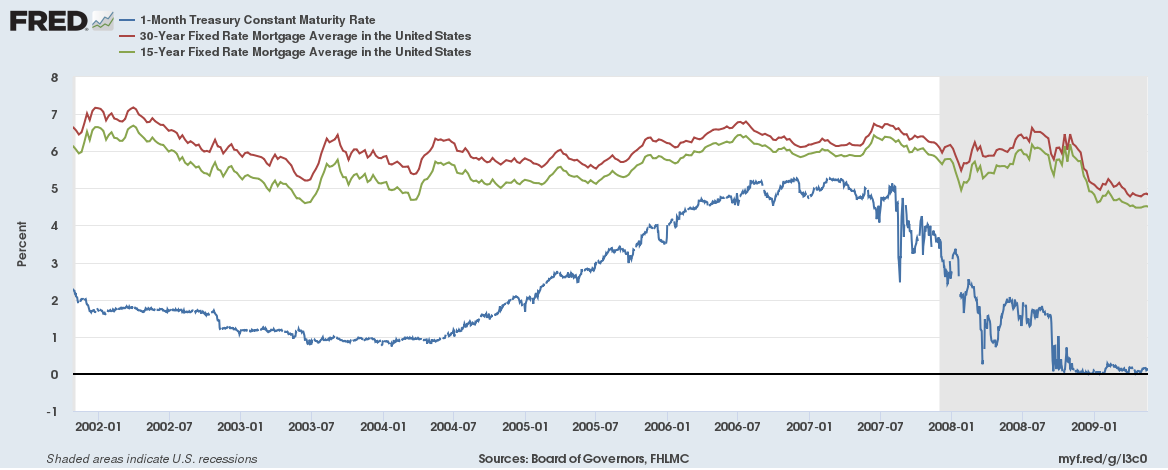
If we look at mortgage originations by quarter or by year it is not obvious that the curve inversion of late 2005/early 2006 resulted in diminished financial activity, nor that the flattening yield curve in 2005 led to diminished financial activity (there is no reason to believe that an inverted yield curve reduces earnings significantly more than a flattened yield curve).  By year, for the 2000s, the highest origination amounts were 2003, 2005, 2006, 2004, 2002, 2007, 2009, 2001, 2008, 2000.  The largest yield curve spread was in 2004 and the smallest was 2006/2007.

So, looking at the Great Recession it appears that UE decreased, markets increased and mortgage originations stayed at high levels (certainly didn't decline) and the curve was inverted for most of 2006 through June 2007 which puts some counters out of the question (such as indicators lagging by several quarters unless by several quarters meaning 6+).

So what is going on?

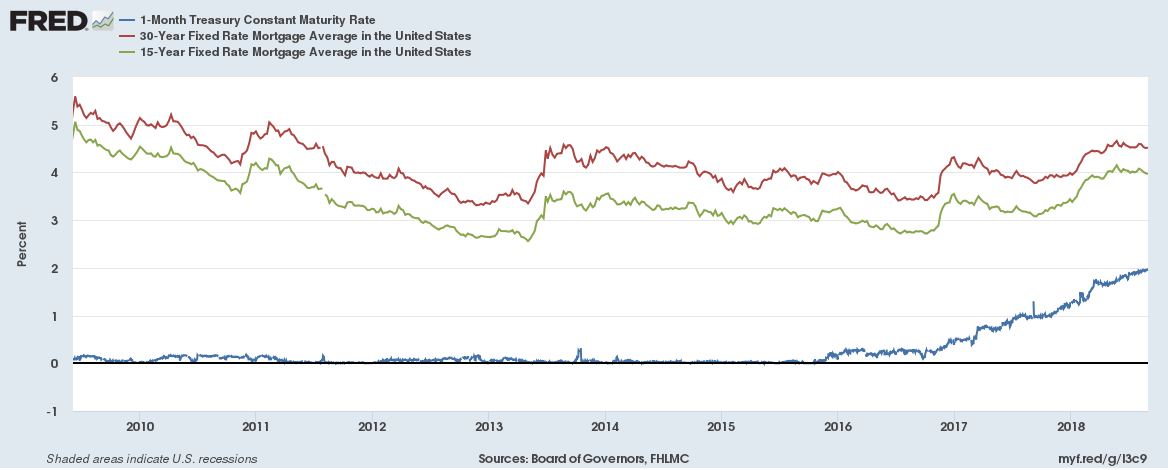
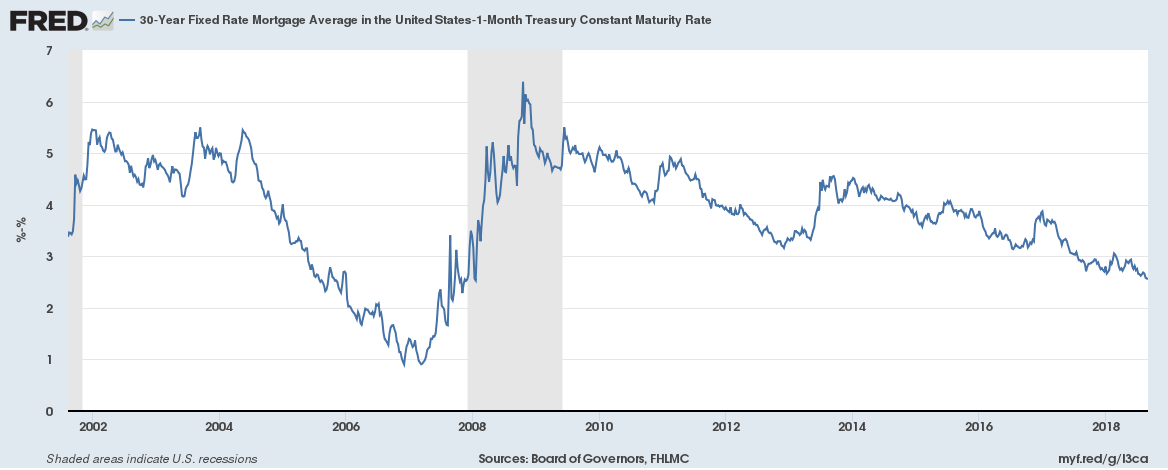
With all the discussion about yield curve inversions almost no one bothers to mention the obvious fact that they are stupid.  They shouldn't happen.  Why would you lend someone money at 2% interest for 10 years when you could lend that same person money at 2.1% interest for 2 years? It takes some very convoluted situations to come up with plausible reasons.  I am happy to say though that it is hard to find market based curve inversions.  The 30 year mortgage rate doesn't dip below the 15 year rate as far back as FRED data goes and neither of the 30 year mortgage or 15 year mortgage ever dips below the overnight or 3 month interbank rates.  However the 30 year treasury does, meaning it isn't simply an artifact of a longer term on the high end.

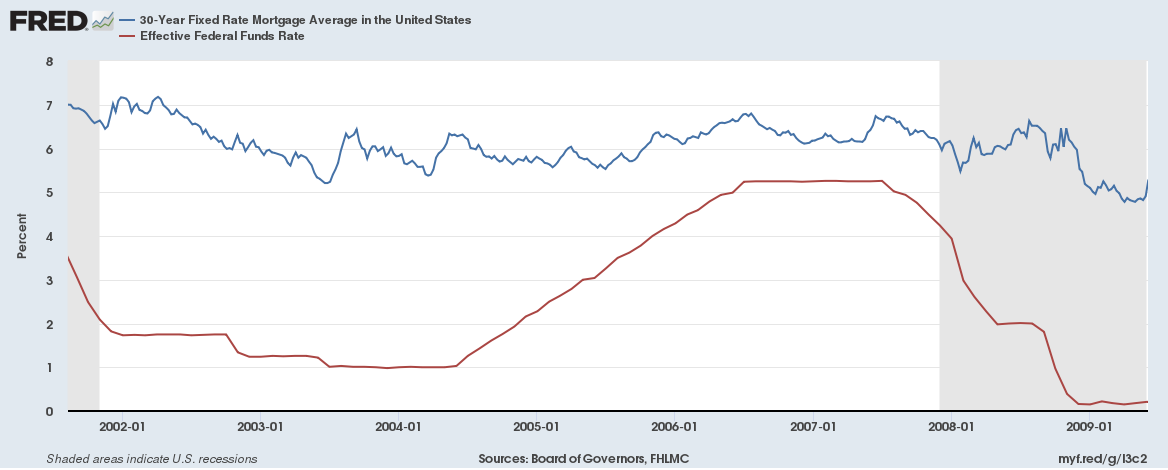
So yields invert when Fed influenced rates climb without market influenced rates climbing an equivalent amount, eventually, after multiple rate hikes, the short end pops over the long end, but again only on securities that are influenced by the Fed, and we see no overt, short term signs of broad economic trouble. 

This means that there must be, somewhere, large frictions in the financial markets.  Why?  Well investors are trying to make money, if short term rates are rising relative to long term rates then people who lend at long term rates should move into at least some lending at short terms, and some people borrowing at short terms should prefer to borrow at long terms now.  These are strong pressures and they should be somewhat proportional to the size of rate changes.

Basically people (or institutions) who are happy to lend long aren't interested in lending short, and people who borrow short aren't interested in borrowing long.  Shouldn't an increase in short rates hit the market somehow though?  People who borrow short should see higher costs and reducing their borrowing which should filter out to the market.  Well there are basically three options that you have when a strategy isn't working, switch to an alternate method, pull out entirely and double down on the current one.  Clearly switching to alternate methods of funding hasn't been happening or the curve wouldn't narrow and then invert, pulling out appears not have happened after recent inversions leaving us with doubling down.

What would this look like?  If you are going to pay more for financing without a rise in long term profitability (ie flat long term rates) then you are going to need to add risk to boost earnings.   There are a lot of reasons why such a course might sound sensible, you expect short term rates to come back down and are just trying to weather the storm, or your compensation is strongly tied to the upside and only weakly to the down side, or any other number of situations.

This expectation fits very well with what we saw in 2005 through 2007, subprime loans (representing higher risk) almost doubled as a share of the market and increased by nearly 5 times in total dollars from the late 90s.  Adjustable rate mortgages (ARMs) roughly doubled from 15% to 30% of the market as well, fitting in with our hypothesis of greater risk taking by short term borrowers (banks).  This also fits the margin run up in the late 90s as the tech bubble peaked along with an inverted yield curve.  We can also start to formulate an explanation for the inconvenient truth that the Federal Reserve has been lowering interest rates (ie easing) into each of the past 3 recessions, getting "ahead of the ball" by a quarter at least without being able to prevent it with stimulus as is supposedly possible. 


 Here we have housing prices continuing to rise with Fed "tightening" and only leveling off when the Fed stops tightening and accelerating into the decline as the Fed "loosens" and its happening again


Eventually borrowed money has to be repayed, margins have to be satisfied.  The race up where you borrow to gain exposure turns into a race down where investors at first liquidate to realize gains followed by to late investors liquidating to prevent further losses, a Minksy Moment.  However, instead of relying on explanations based on greed (aren't people always greedy?) or hubris (aren't they always filled with this?) we have a rational explanation.  The Fed cutting rates makes the previous strategies profitable again with lower risk. 


Tuesday, September 25, 2018

Rising Interest rates part 1

Short term interest rates, be it Libor, the Federal funds rate, 1 month Treasuries have been rising for a little while now. Absent from most discussions is the simple fact that rising short term interest rates are bad for banks, the only thing worse for banks is rising short term interest rates coupled with stagnant or falling long term rates, quickly to illustrate.

Suppose you start a bank with $1,000,000 in capital, and have a 10% reserve requirement. You raise that capital at the short term market rate of 1% interest and you loan out the $900,000 that you are allowed to at 4% interest for 30 year mortgages. You’re bank is set to make 3% interest on $900,000 or $27,000 a year which then goes to paying for your tellers, security guards, property tax, and live goats that the bank president sacrifices to Moloch every third full moon to prevent defaults. Whatever is left is your profit, and since I am pulling numbers out of my ass lets say profit rates at this level are 1%.

What happens if short term rates rise to 2% in your second year? I’ll tell you what happens, you aren’t making money anymore, you are in fact just breaking even. If interest rates rise above 2% then you are losing money and will be bankrupt as soon as those losses eat up the $9,000 in profits you booked the first year. How can you survive? Well if long term rates also go up by a percentage point to 5% you can raise more capital at 2% and lend it out at 5%. Your average profit margins will be smaller in percentage terms but they will be positive instead of zero or negative and your absolute profit will be higher if you can raise more than another million.

What if long term interest rates don’t lift off with the increase in short term rates? Well you could cut costs or try to increase earnings by betting on riskier investments. Or you could do both, you encourage your loan originators to pump out large numbers of loans and let them cut the quality of the loan recipient to do so. So you have guessed it, I am talking about the housing bubble again. Lets look at short term rates vs long term mortgages shall we?


OK, well 1 month Treasury rates went way up without 15 or 30 year mortgage rates really reacting but perhaps banks borrowing was cheaper?


Crap, you could get over 5% on a 3 month CD? What time to be alive… well unless you were a banker. I guess if you were a banker you could borrow from the Fed at low rates until things calmed down, right?


Well crap.


How could this happen though? How could long term rates stay so unfazed when short term rates increased by over 500% in less than 3 years? One partial explanation is that once rates start rising the attempt to maintain profitability means pumping more and more mortgages out the door from your staff (or just an increase in the dollar value of the average loan), basically “increasing” their productivity, and also increasing revenue from the loan origination costs. To loan more however you have to raise more capital so all the banks are competing to draw in more dollars to loan out quickly. You also have to convince people to take the loans out, which means ferocious competition on the mortgage side keeping those rates down.

This doesn’t explain everything, such as why the short term rates increased in the first place, but it fits with a lot of what happened from 2004 through 2008. The effect will be larger or smaller based on the total amount of loans made before the rates started to rise, the larger the amount the more stress on the system. How are things going now?


The spread is definitely compressing, here is the 30 year mortgage minus the 1 month Treasury rate


But don’t expect banks to make the exact same mistake twice, it is unlikely that there will be a massive surge in subprime lending this time around. Honestly they aren’t even being pressured to thanks to the Fed’s interest on reserves (IOR) program, which has had its rate pushed up to almost 2% and has basically kept pace with short term borrowing costs allowing banks to carry large amounts of reserves essentially for free recently.

The growth in debt that has been driving interest rate increases recently has been government issued.


There are three things that are particularly insane about this graph. First that the economy has been at or above full employment and debt to GDP is still increasing (albeit at a much slower rate than from 2008 through 2013), and secondly interest rates have been extremely low pushing the cost of borrowing down for the government and reducing one of its major costs. Thirdly the Federal reserve has been remitting roughly 60 billion dollars more per year post crash than it did pre crash thanks to its earnings.

The sum of these three is significant. The 2001 recession saw tax revenue drop by about 1.5% of GDP and it took until 2005 to exceed revenue from the year 2000 (partly due to tax cuts), the 2008 recession saw revenue drop by about 2.5% of GDP and did not see its 2007 peak exceeded until 2013. A simplistic projection assuming tax receipts in 2007 staying stable vs dropping implies that the crash added 1.2 trillion dollars to the debt due to lower tax receipts alone. This would be more if you compared to the average growth rate of receipts leading into this era. Meanwhile the Fed has remitted around 600 billion dollars more to the Federal government over the last 10 years more than the trend leading into the Great Recession, and interest rates on government debt have been extremely low, had they been merely low (2 percentage points higher) with the same spending+tax rates then debt would be around 2 trillion dollars higher.

The fact that Federal debt levels have risen as a percentage of GDP over the past two years with these tailwinds is concerning, but there are a few points preventing things from getting out of control immediately. First is that only about 60% of the Federal debt comes due in the next 4 years, which means that an interest rate hike of 1 percentage point right now would increase annual debt payments by less than 25 billion (assuming an even distribution of maturing debt over the next 4 years) in the first year, and of around 90 billion by the end of the 4th year.

The second major point is that during a recession the Fed typically ‘stimulates’ by slashing interest rates and increasing its balance sheet which increases remittances, meaning that the Federal government is unlikely to have to fact the trifecta of rising interest rates, lower remittances and lower tax revenues all together.

To be continued.

Thursday, September 20, 2018

Picking up Pennies and the Steamroller

Short term gains don't always translate into long term gains. The obvious example is selling options, you sell a put every year for $1,000, adding a grand in earnings every year right up until the market tanks and you have to pay out a large sum. Some investigations have shown that put sellers make more money off the puts than put buyers do off the large, but sporadic, payouts. However, and to the surprise of many people, how much money you make is only half the game, when you make it also counts for long term investing. Lets take a hypothetical example using some historical data (and some guesses/approximations).

For example I pay $1,000 for a put option on the S&P 500 to you every year on January 1st and you turn around and stick that money in the market. Years one through five the option expires worthless, and then year 6 there is a market crash and I cash out my put for $5,000 and put that $5,000 in the market. The simplistic view is that you are currently ‘up’ $1,000 on me, as I paid you $6,000 and you paid me $5,000 out. A slightly better version is that you are “up” $1,000 plus gains from having that money in the market for 5 years. The correct answer though depends on what happened after I put the money in the market. I got a lump sum that was conditional on the market dropping a substantial amount, and there are certainly times where putting $5,000 in all at once out preforms putting $1,000 in 6 separate chunks.

Following our hypothetical you might have invested $1,000 in Jan 2003 when the S&P was around 900, 2004 at ~1,100, 2005 at 1,200, 2006 at 1250, 2007 at 1,400, and 2008 at 1,450 meaning your average purchase price is (ignoring dividends etc) a little over 1,200. I instead get $5,000 to invest at the end of 2008/early 2009 when the market is around 950. Come 2018 my $5,000 purchase in 2008 is worth a (with the S&P at 2,900) little over $15,000. The $6,000 averaged at 1,200 is worth a little over $14,500.

This shows how buying puts can, potentially, turn a profit even when it "costs" more to buy a series of puts than the total payout because the award was associated with the best market buying opportunity in recent memory.  What about the put seller?  Is he also "up" $15,000 having put none of his own money in play and was just riding off your $6,000 in capital?  Well no, he paid you $5,000 so he can't be up the $15,000, is he up $10,000 then?  Well, no.  He owes you $5,000 in 2009, not in 2018.  So is he up $1,000 compounded from 2009 to 2018?  No again. To get the $5,000 he (to make it simple) sells the exact shares he bought with the $6,000 you paid in yearly installments.  He bought when the S&P was at an average of 1,200 and $6,000 bought him 5 "shares" of the S&P, but he is selling when the market is around 950, and 5 shares of the S&P at 950 sells for $4750.  The other $250 has to come out of his own pocket, so his profit in this example is -$250, even though he got $6,000 for a payout of $5,000.

There are a lot of lessons you could glean from this example, such as don't keep your collateral in the same securities that your obligations are priced in.  

Returns and Crashes

Buy and Hold.  This is the strategy of the EMH, where you humbly accept that you can't beat the market, and just hitch in and ride along.  Just don't sell during the downswing and you will be fine.  Just don't sell.

Are you better than the market?  Do you know better than the average?  If you take this advice you are tacitly assuming that you know better than most people, that you are better at not selling.  Not selling, which some people struggle with during bull runs (gotta lock in my gains!), becomes much harder during a down swing.  Why do markets fall?  Because there are more buyers than sellers.  Straight line definition, if no one sold there would be no downswing!

But we get downswings, and not just normal buying and selling, massive volume downswings with 5x the volume of pre-crash movements at times. 

So why are you better than the market at not selling?  Why are you going to be better than the guy yelling "sell, sell, sell" when the panic hits?  How is this justification different from the guy analyzing Tesla's balance sheet and coming up with 'reasons' why his position is the right one?  Remember that your investment strategy, no matter how simple, requires you to be good at something, even if it is "not selling" just to match the market. 

Do people sell because markets crash, or do markets crash because people sell?  The two are inseparable, to avoid selling you need to have an idea of why people commit this investing sin.

A lot of selling is structural.  People who profit from selling puts during the bull market end up selling into the dip quite often.  Sometimes they are literally forced to sell to pay out when the option approaches expiration, and sometimes they notice that the value of their collateral is dropping while their obligations are jumping.  Selling puts and using securities as collateral doubles your leverage, more gains in good times and more losses in bad.  Some people feel forced to sell as they see bonuses dry up, fear of unemployment, and declines in other personal assets that accompany (or cause) recessions.  These relationships can be large and complex, when the markets were demanding that AIG raise capital in 2008 they went borrowing, at least some of the people that they borrowed from would have sold stock to make the loan or buy equity in AIG. 

Leverage is the number one cause of selling, and it can come from anywhere be it covering a position that turned against you or the car payments you owe on the vehicle you stretched to buy.  Did you co-sign your child's college loans?  Welcome to leverageville, population: you. 

Tuesday, September 18, 2018

The Paper View of the Economy

What distinguishes the Austrian view of macro economics from the Keynesian or Monetarist view is simply the level of focus.  Keynesian and Monetarist views rely on the paper representation of the economy, where the functions of the economy are aggregated and then represented by a series of numbers giving them a bird's eye view of everything.  Low resolution at the points which generate the numbers, but a good broad overview, while Austrians take some (not even a lot in particular) of that granular generator into account. The lack of communication across the schools which have many otherwise similar assumptions and conclusions about economics seems to be because of a modest shift in the underlying assumptions.  A claim under one set of assumptions would sound false and perhaps even ridiculous while being perfectly reasonable under another, its the nature of modeling (yes, what Austrians do is fundamentally modeling).

One issue with the paper view of the economy is the urge to translate it down levels which look like paper representations, but aren't.  Stock prices are a great paper view of a company, if you buy shares of Tesla and three years later those shares are worth 30% more then you can realize a 30% profit.  It doesn't matter if the shares rose because of an increase in sales, or the change of a CEO, or new product lines or a contract with the government.  It also doesn't matter (as long as you weren't leveraged) at the end of the three years if the price jumped 30% in the first year and then was flat, or fell and then rose or rose as a constant rate.  All the changes together, plus all the other changes in the economy, should be reflected in that one price as best the market can tell.  So if you want to follow the value of a company the stock price multiplied by the total shares is all you really need.  

All prices however are not inclusive.  Home prices are a good example of this, if you buy a house to hold in the hopes that property values will rise and let it sit empty for three years and then sell it for 30% more than the initial purchase price you have not made a 30% return on your money.  Why not?  Because as any homeowner knows houses come with carrying costs, you have insurance, taxes and maintenance costs.   You can see this quite clearly when developers buy property with the intention of tearing down existing structures.  They tend to tear down as soon as possible, even if they aren't intending to build immediately, as the taxes and insurance for an empty lot are generally significantly less than for lots with buildings*.

When you make an investment in housing based on expected sale price appreciation the length of time between purchase and sale is important to calculating expected returns.   Scott Sumner wanders into this distinction without noticing it in a recent post on the recent growth oinLas Vegas.

But I argued that these cities were fast growing, and this problem was relatively mild.  In my view the malinvestment is better termed “too early investment”—some houses were built a few years before they were needed.  The Austrian counterargument was that these houses would remain empty for decades, and eventually depreciate sharply (in a physical sense.)  It looks like I was closer to the truth.
Lets look at some basic estimates for carrying costs.  Property taxes plus insurance tend to combine for about 1.5-2.5% of a properties sale vale annually.  Long term interest rates during the last leg of the housing bubble were around 6%.  Estimated carrying costs for a unit would be around 7.5%** without figuring any housing depreciation or maintenance. 

Lets look at house prices


Home prices are currently about 25% off their 2006 peak after a 6 year run up.  So lets say you borrowed money and built a house you expected to sell for $230,000 in 2006, and you expected a 5% profit from it after all yous costs (including any transaction costs and the cost of financing your loan for 1 year while it was built), so your total costs would be around $219,000.  You go to sell now after riding out a huge downswing, your carrying costs have eaten up 88% of the $219,000 which is ~$193,000 in costs over the years (not compounding).  Then you go and sell at today's prices of $185,000.  Your final 'profit' on that project is negative $227,000.  

Ok, but you aren't that dumb, why leave the place empty for 12 years, rent it out and that negative $227,000 will be a reasonable number.  Well Vegas currently has a price to rent ratio of about 20:1, so a house that sells for $185,000 now would rent for about $9,300 a year, over 12 years that would be $112,000, but Vegas had a vacancy rate of around 10% over those last 12 years, pulling that down to $100,000, making your final loss on that $219,000 loan about $127,000**

So actual market returns on Las Vegas construction that was started late in the housing bubble are reasonably calculated at about -58%, and the Las Vegas housing market crash saw about a 60% decline in prices, which is pretty effing amazing projection for a market that was in 'crisis'.  

To justify Sumner's claim that the housing was "to early investment" you have to extrapolate the price trend of the last 6 years another 10-15 years to get to that investment at a break even point. So housing construction in Las Vegas was to early by AT LEAST 25 years, under the best assumptions.  


*There is more to this story as the cost of tearing down carries either interest payments or opportunity cost of that money, so you can see speculators sit on buildings for long periods of time. 

** These numbers understate the case quite a bit, the price to rent ratio is for gross rent, which assumes that utilities are included which then come out of the owners pocket, and it includes nothing for general maintenance and doesn't adjust for the fact that rents in Vegas are higher now than they were over most of the past 12 years.  These more than compensate for lower interest payments that would have come from using the rental into to pay down principle.  

Monday, September 17, 2018

EMH and the Fed, part 2

I finished the previous post with an implication about the Fed. The EMH basically assumes that all participants are profit seekers, and the Fed lives in a nebulous world when it comes to profit. They are, of course, extremely profitable, remitting $80 billion dollars to the US treasury in 2017, which is tens of billions more than the most profitable companies in the world pulled in. On the other hand they are literally allowed to print money and not making a profit would be difficult with that power. The man goal over at the Fed however is not to make a profit, it is to ensure ‘economic stability’.

It is a fairly straightforward proposition that any market inefficiencies created by the Fed are going to be proportional to the size of its interaction (that is interference from this point of view) with the markets, which is half of the reason that this topic is timely now. The Fed took previously unheard of positions in markets in an attempt to stabilize after the 2008 crash and introduced new programs like interest on reserves (IOR) which continue to influence the market now. 

The second half of the explanation is that the Fed also committed to actions during the 2008 crisis and that has set some level of path dependency for their future actions. While there were a few predictions prior to the 2008 crisis that the Fed would go to extraordinary measures in the event of a crash the particulars were thin. It wasn’t obvious how big the crash would be, how it would pass through the economy, what the Federal Government’s response would be and what the Fed’s choices would be within this context. The actual actions of the Fed have limited its possible courses for the next recession, and as i will go into further detail in future posts will set up a tension and possible showdown with the Federal Government at that time.

This is my first level reconciliation of the EMH and Austrian Business Cycle Theory, that the EMH is a strong and persistent force that generally makes beating the market difficult, but that monopolistic interventions in the market made (in this case) by the Fed can open up brief windows that will allow outsized gains to be made and that those gains are proportional to the size of the intervention. The size of the intervention has been large, and I will go into further detail about the conditions that will force the Fed’s hand in future posts.

Saturday, September 15, 2018

EMH and the Fed, Part 1


The Efficient Market Hypothesis

If someone is going to offer you investing advice (for free or for a price) they are implicitly taking a stance on the Efficient Market Hypothesis (EMH), those suggesting individual actions are taking the con stance and those suggesting low fee mutual funds the pro. Either way it is interesting that so few people argue for or against it with so many financial advisors out there, this is my stance.

The EMH basically states that you can’t consistently outperform the market because any information that would lead you to a better than average decision is going to be incorporated into the price quickly (how quickly and what type of information? Well that is why there are different versions of the EMH). To make a big leap here the fewer people believe in the EMH the more likely it is to be true, and vice versa. To explain a little bit, information only changes prices when individual owners shift their behaviors in response. If Tesla announced that they had produced and sold twice as many cars as they had expected in a quarter you will see people who were thinking of selling pulling their shares off the market, shorts covering their positions and people who doubted Tesla’s long term situation convert and try to buy stock. These are the actions that shift the stock price in the wake of the news.

Imagine a world filled with passive investors, chunks of paychecks are automatically routed to funds to buy shares based on a predetermined algorithm, where no one picked up the phone or logged into their online broker when they read the news, content to sit back and collect dividend payouts from companies. What happens in this world is that stock prices rarely, if ever, move, and the market would be as easy to beat as you could hope for*. Contrast that to a world where every person is scouring source material, reading perspectives, following announcements and building models, this is a world in which gaining an edge is enormously difficult. Why would you even bother trying to beat the market in such a world? Why not just accept average returns and save all the aggravation?

Or to put it another way people who don’t believe in an efficient market are the ones creating the efficient market.

This concept doesn’t apply just to stock markets, a few months ago David Henderson had a post that touched on a related idea where he says “But now consider what happens if people expect, with higher oil prices now, that there will be more production a few years later. Why a few years? Time to drill, time to explore, time to discover. So futures prices a few years hence fall.”

If you take his thought one step further you get to the idea that high oil prices now will cause people to invest in drilling and exploration and lead to lower prices in the future. I really like this example because you can completely bake your noodle imagining causal chains, where noticing that oil production is going to be insufficient in the future causes you to buy futures contracts, which drives the future price up, which causes people to horde oil to sell at that higher price which causes a shortage today. Or buying those contracts pushes up the price, which encourages more marginal exploration and investment which leads to an increased supply and prevents the shortage.

This is the world of markets, where discovering a truth can change it into a falsehood.

Or take Warren Buffett, the richer, more successful and more well known he became the more people picked up copies of “The Intelligent Investor” and tried to apply it’s methods and logic. Naturally those investors are functionally competing with each other, driving up the values of the stocks that are considered undervalued and reducing returns. Rather than turning 1,000 people into the next Warren Buffett the popularity of value investing will prevent the next Warren Buffett from arising in that space.

This is the world of markets, where past performance doesn’t indicate future performance.

This is my view of the EMH in action, it is not that there is no move you can figure out that will beat the market but that figuring it out is the action that will close that window. How quickly the window closes depends on how efficient the market is and how many people noticed it, which is obvious. What is less obvious is that a window can remain open if there is an entity that isn’t profit oriented or capital constrained functionally keeping it open.


*Or perhaps impossible, as every buyer needs a seller.

Friday, September 14, 2018

Causes and/or indicators of recessions


From one point of view every recession looks different. There were deflationary recessions and hyperinflationary recessions which led some to posit that regular old inflation was incompatible with recessions. When their suppositions were proved incorrect we got the term stagflation and a host of new explanations mostly based on what we hadn’t yet seen. After a few more it was near universally agreed that what we definitely hadn’t seen was a broad recession cause by declining housing prices, another example of noticing a truth causing it to be no longer true. So we can have hyperinflation, deflation, stagflation, bubbles in abstract goods (the tech bubble) or solid goods (the housing bubble).

On the other hand, at least recently, recessions seem to have some similarities. The 10 year minus 2 year yield curve (YC) has inverted before each of the last 5 recessions in the US. In each of the last 3 recessions the yield curve reverted before the official beginning of the recession, and each of those events saw market prices reach their absolute peaks after the inversion of the YC.

There are four basic possibilities when two things appear to be strongly correlated, with our example it could be that the recessions was causing the yield curve inversion (unlikely since the inversion occurs first, and sometimes reverts before the recession), it could be that the inversion causes the recession, it could be that both have the same cause or it could just be a coincidence that will disappear in the future (I am disregarding this one for now at my own peril).

So let us take a look at the inverted yield curve. First off it makes no economic sense for the curve to ever invert, because the curve is about lending to the same entity. If the government defaults on its debt in the next two years this will affect both holders of 2 year treasuries and 10 year treasuries, so any risk that is built into the 2 year is built into the 10 year. The 10 year bond can have risk that the 2 year doesn’t, any risk that might rear its head between year 2 and year 10 wouldn’t impact the 2 year return, but would the 10. Likewise opportunity cost favors the 2 year bond, if another, better looking investment opportunity comes along you are more likely to be able to take advantage of it without other costs if you hold a 2 vs a 10 year note.

Functionally you see this in practice. 15 year mortgage rates are lower than 30 year mortgage rates, using FRED data we can see (going back to 1992, when their data starts) that the 15 year rate never exceeds the 30 year rate, this is what you would expect from a reasonably rational market.


This is not an artifact of looking at the longer end of the curve as the 30 year Treasury minus 10 year Treasury was also inverted before each of the last two recessions. This gives us a clue, rates that are (more) market based don’t invert even in the face of major financial issues in the economy. I would say this makes it likely that the cause of YC inversion lies in non market participants, be it the Fed or the Federal government.

Now an inversion could occur one of two ways, either the shorter term rate rises faster than the longer term rate or the longer term rate drops faster than the shorter term rate.


Here we see in each of the last 3 inversions the short rate has risen faster (this is also true for the previous two recessions but the graphs are far harder to read on those longer timescales). It is also true that each time that the YC reverted it did so with the shorter term rate falling faster than the long term rate.

There is in the data set one false positive, with a brief inversion in 1998, this did not shortly preceed a recession. This is also the only one where the inversion came with the long term rate falling faster than the short term rate.

If we take what is generally accepted, that the Federal Reserve controls (or has more influence over) the short end of the curve we have our culprit. We can feel fairly confident of this particularly because the short rate falls to cause the reversion. If the long rate bounced up to cause the reversion it might be that the Fed was simply ahead of the markets sometimes, or some other explanation, given the Fed is basically always raising rates into the inversion followed by lowering I am calling this capitulation by the Fed. 

Now we know that the Fed has a dual mandate, full employment and price stability.


This graph is a little busy, so a brief description is in order. The blue line is the employment rate that the Fed cares about the most, it is the unemployment rate (UE) minus the Natural Rate of unemployment (NRUE), full employment is when this line is at zero, and in an ideal Fed world is where it would always be. The red and green line are different inflation measures.

What I think is of note in this graph is the lack of any inflation driver that would have convinced the Fed to raise rates in any of the events leading up to the inverted yield curve. A couple of better looks with the YC and the inflation measures together.


So two final graphs to wrap this portion up


First


The YC vs UE - NRUE

It appears that UE-NRUE leads the YC into its inversions


The Federal Funds rate vs UE-NRUE

Here is the interesting stuff. In theory the Fed stimulates the economy by lowering the Federal Funds rate. This is supposed to increase borrowing in turn increasing investment which in turn increases employment. The flip side is also supposedly true, the Fed raises rates to slow down an overheating economy and reduces employment. This graph shows that the opposite is basically occuring. There is a natural objection here, that the Fed reacts to the market and they raise rates when UE is to low already, and lower rates when it gets to high. I do not think this is a satisfactory explanation. In 1989 when the funds rate starts dropping the economy is supposedly above full employment, it doesn’t get to the “ideal” line of full employment until the start of the recession. The same thing occurs in 2000 and 2007, and one interpretation of this is that the Fed’s one measure of a healthy economy doesn’t occur until a recession hits.