Monday, September 23, 2019

Liquidity something

The big news from this past week was the Federal Reserve's sudden re-entrance into the overnight repo market, and adding liquidity.  First question is was this a demand spike or a shortfall of supply?


No real demand spike, but a persistent decline in excess reserves has been decreasing the available supply.


 Supply is also short in another sense


It seems unlikely that there is no maximum level of debt for a country, be it government, private or combined.  Obviously it would be shifting based on factors such as interest rates but conceptually it is hard to argue that debt to gdp ratios can go up indefinitely, and it is likely an empirical answer you will get. 
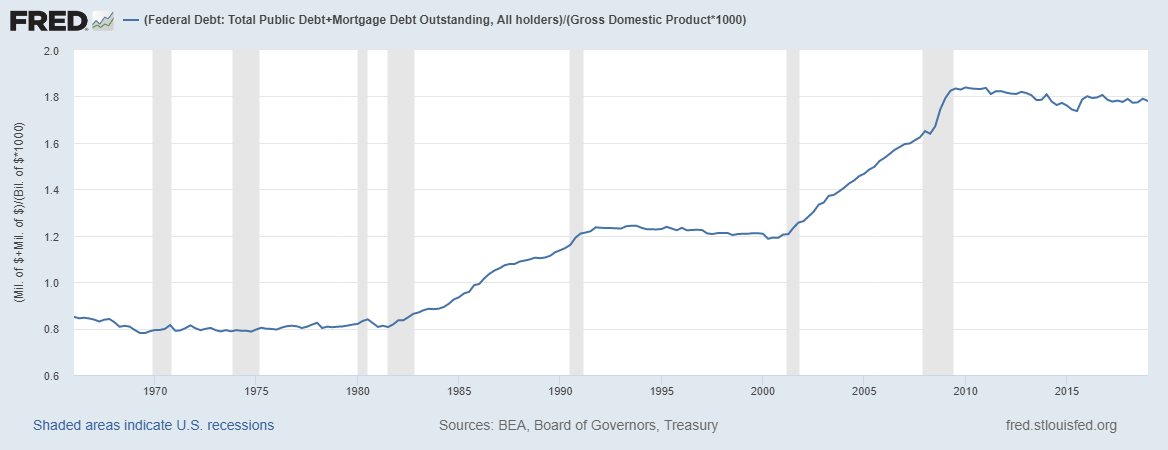

So here we are, a major financial crisis that started with massive debt levels and 10 years later those levels are roughly the same.  We have now a strong policy of government stimulus in the face of recessions, with 2008 starting with a little remembered 110 billion dollar stimulus before a recession was officially recognized which came 7 months after the Fed started an easing cycle.  Who is going to get hit this time if debt is increased?


To maintain the current level of total debt there will have to be a reduction to offset any government stimulus.  The price rise you see above should be viewed even more skeptically than the one up until 2007 because it is on lower volume.  Below is existing home sales (had to change sources)

United States Existing Home Sales

Plus new home sales


We are looking at significantly lower volume, significantly less dollar value to gdp for mortgages in a larger country (in real prices the peak isn't as high as the previous peak though).


If this next recession is significant, with significant additional government debt I would expect home sales volume to die, and when volume dies volatility explodes. 

Thursday, August 29, 2019

Closed all shorts

Closed all shorts at significant losses.  Currently anticipating markets to rise for next 6 months, considering going long. 

Monday, August 5, 2019

perspective

Some people describe the housing bubble of the early 2000s as being isolated to a few major cities, their outsized effect being what drove the events that unfolded.  Smaller cities, such as Cleveland Ohio, had much smaller run ups, and smaller busts.  As usual this is a matter of perspective.


The two series diverge in 2000, with the national series running up 85% to the Cleveland series 23%, the declines are actually reasonably close though with the national rate dropping by ~ 27% peak to trough and the Cleveland series dropping ~22%.  From that perspective the national average had a larger run up and decline, however from another perspective Cleveland lost all of its post 2000 gains with its index dropping back to 1999 levels, while the national average pushed back to only around 2003.  The rebound has also been dramatically in the National averages favor with the 2006 peak being matched in 2016 and a steady rise after that while Cleveland only recently matched its 2006 peak.

The other perspective is then that without the housing bubble Cleveland's home prices would have been flat or falling while the national average would have been rising, albeit more slowly and that the impact on Cleveland was larger because the difference between a rising and falling market is much greater than the difference between a rising market and a market that rises at a higher rate.

*****************

I like thinking about different ways you can explain the yield curve, one way is to use the Cleveland perspective.  That is the difference between getting a 30 year bond at X rate or a 20 year bond at a slightly higher rate is small compared to getting out of equities during a rise and getting out of equities during a fall.  If you are jumping out of the way of a steamroller it doesn't matter much if you jump into a bramble patch, even though that bramble patch is far inferior to a manicured lawn because 99.9% of your desire is simply not getting crushed.


Monday, April 29, 2019

Short UNH

Puts bought on UNH again, still feel good about my general thesis and am just trying to pick good times to go short. 

Thursday, April 18, 2019

Wednesday, April 17, 2019

Closed UNH, 3/4ths of HQY

Closed out my first position posted here, put on UNH up ~280%, and UNH up ~105%, and a position I took this morning which was a put on abmd.

Selling here because I find myself frozen, unable to think of what to do next.  This is an unhealthy mindset that I am familiar with from playing poker years ago, better to step back, collect thoughts and then proceed.  Buying a put on abmd worked out, but I bought because I didn't want to watch a big move down right after I sold out of half my exposure, basically it was emotional and shortsighted, which probably will lead to other similarly based decisions. 

To state/restate my investing theory in bullet form.

1.  The yield curve inversion is an inflection point.  Approaching the inversion is a different investing environment than the period during the reversion and widening of the curve, companies and industries that do well in one probably won't do as well in the other.

2.  The curve takes a long time to narrow, long enough for the 1st effect to have knock off effects on the economy.  If housing booms from the environment then eventually construction firms will boom and then logging, reits, and realtors etc will boom.  The early stages of the boom are when the first sectors take off, the height of the boom is when all the sectors are growing and the early stage of the bust is when the leading sectors have lost their growth but it has not yet hit the secondary sectors. 

Clearly I picked the health care industry (as in stock prices within) as benefiting from the previous circumstances and the movement of prices recently has been a point in favor of my hypothesis.  Now I need to move forward on projecting the timing and depth of the pullbacks and also anticipating the first order knock off effects, not staring at prices willing them to go down further.