Monday, October 22, 2018

"Real" Interest Rates


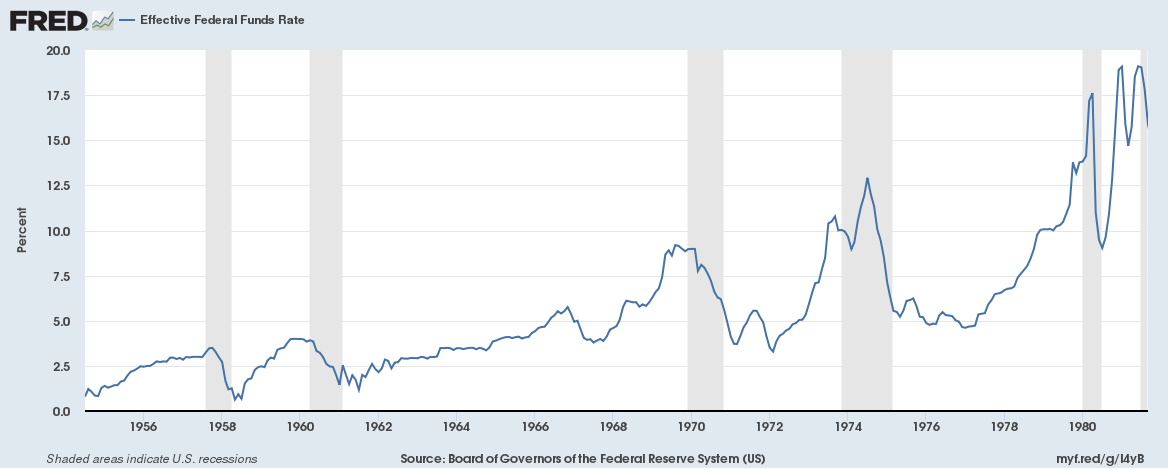
We are diving right into this one, no words to start, just a graph! 

Red line = Federal Funds rate, blue line = Federal funds rate minus 5 year expected inflation.

From July 2003 to June 2004 the Effective Funds rate is essentially flat at 1%, during this time inflation expectations increase by about 1 percentage point.  This represents roughly a 67% increase in the expected inflation rate, from around 1.5% to 2.5%.


What is the Fed to do?  Well, start raising rates of course.  The Fed raises rates over 4 percentage points from June 2004 to July 2006 while 5 year inflation expectations move up another 15-20% to their peak at just under 3% in early 2005.  Meanwhile at the 10 year break even rate


So 10 year inflation expectations peaks right before the Fed starts raising the funds rate, and then is in the 2.2 to 2.8 range right up until August 2008 (not shown here).  Another look


The spreads here are small, but functionally doubled.  Early in the graph 10 year inflation expectations are basically 0.35% per year more than 5 year at the widest points, given that 10 year inflation includes the next 5 years as well this implies that years 6-10 should have around 0.70% higher inflation than years 1-5.  That isn't a huge deal but it is notable when rates are in the 1.5-2% range.

What is a huge deal is that the Federal Reserve raise interest rates by 4 percentage points and inflation expectations are virtually identical after the last increase to what they were at the first increase and were slightly higher for good portions of the rate increases.

If you are of the opinion that the Federal Reserve can control inflation (expectations) with the funds rate then you are looking at a 400% increase over 2 years to stop inflation expectations from rising.  And don't give me "long and variable lags", these rates include the 10 year break even rate which stops rising BEFORE the 5 year rate does.

There is a sentiment to be found that the Fed was to tight during this period, that they either raised rates to far or held them up there for to long.  This is awkward to argue as the lower of the 5 and 10 year break even rates stays above 2.15% and they were both right around 2.35% when the Fed starts easing in 2007.  Then the Fed lowers rates by 3+ percentage points from July 2007 to May 2008 and inflation expectations stay in the range the Fed wants them to.

All of this is just a set up for


This is about as close to a smoking gun as you can have against monetarism or Keynesian economics, both of which rely on using real interest rates as a mechanism for driving down the savings rate and driving up the consumption rate to combat a recession.  First I will zoom out as far as the Fed data goes to show how poorly correlated real interest rates are with the savings rate


Now a zoomed in section from the financial crisis


The savings rate fell and held steady while real interest rates climbed.  There are multiple measures here of what a "real" interest rate should be, the 10 year bond rate minus 10 year expected inflation, the same for 5 and 5, 2 year bond minus 5 year inflation, 2 year treasury minus the current inflation rate, the federal funds rate minus 5 year inflation and they all show the same pattern.  Real interest rates climbed and the savings rate ignored them, then rates fell and the savings rate ignore them and then the early stages of the financial crisis started and the savings rate moved higher and quickly.  I'm not going to discuss the spikes here, just the trend, the savings rate went from around 4% in the early stages of the recession to above 5% in about 6 months and up to the 6-7% range with peaks above 7.5%. 

If you read my previous posts on the yield curve you would note that the stock markets started rising more rapidly right around the same time that real interest rates started rising during the above period, and not long before housing starts fell off a cliff.

I am going to return to my explanation of a bifurcated market, that there exists two (or several) different sets of participants with little cross venturing.  Low, and especially negative, real interest rates should benefit borrowers at a cost to lenders.  Higher rates should benefit lenders at a cost to borrowers, and lower rates vice versa but how many would be borrowers can benefit by switching to being lenders?  If you have a cash reserve and are thinking of borrowing because real rates are low then your cash reserves are going to suffer poor growth roughly equal to the gains you get by borrowing the money for a project rather than using your own.  Moving towards equilibrium is difficult in this way, which is why the channel of rising real rates encouraging savings and decreasing real rates reducing them is central to modern macro theories and why the above graphs are so devastating to them.


Monday, October 15, 2018

Yield Curve Part 2

In Part 1 I looked at the end of the Yield Curve (YC) inversion, when it is reverting back to the normal state of short term rates being lower than long term rates.  Here we are going to look at the early stages of flattening and then inversion.

To start with I don't think that there is much that is special about the curve inversion SPECIFICALLY.  Very flat curves are just as interesting (ie tricky to explain) as the actual inversion, and there is no correlation between the depth or duration of the inversion and the eventual recession.  The inversion in 2000 was much deeper than the on in 2005 and the 2001 recession was much milder than the 2007.  There aren't a lot of consistent explanations for why a flat curve with a 0.1% difference between the long and short rates is a completely different animal from a curve with a -0.1% difference (ie inversion). 


To begin with the blue line is stock market capitalization to GDP, which is not a commonly used metric.  I'm starting with it to head off one particular complaint and that is that inversions happen when the Fed raises rates and the Fed raises rates when the economy is doing well and markets should go up when the economy is doing well.  Market cap to GDP shows (to some extent) when increases in market value exceed increases in GDP.  Lets add in the Federal Funds rate


This graph is very awkward for traditional cause and effect explanations of how the Fed should work.  First the Fed raising interest rates is supposed to slow down the economy, secondly the Fed increasing interest rates on the short end should push long end rates up (this appears to be correct, only not close to a 1:1 relationship) and third increasing short rates should push down inflation.  The latter two combined should producer higher real returns for bonds (higher returns that can be locked in with lower near term inflation) which should make bonds relatively more attractive than stocks, and the first note should slow earnings for stocks. 

Basically the Fed increasing rates ought to lead to lower stock market levels not higher, but what we see is the opposite, increases in the funds rate see higher stock market valuations in both raw levels and relative to GDP terms. 


Housing starts generally are funded with short term loans when started with borrowed money.  For the last two recessions it looks like housing starts peaks and then falls (to varying degrees) when the YC inverts but it is hard to use cost of borrowing or bank spreads to explain this when the starts were increasing with a very flat curve in the late 90s and increasing with a sharp funds rate increase during the 2000s.  In the 2000s housing starts continue to increase for 18 months before declining dramatically.

You could argue that this supports the conclusion that an inverted yield curve really is a different animal than just a flat one, but I don't think this holds as a significant factor.  First new home starts in the 90s is more of a high plateau than a peak and the decline isn't steep and secondly total construction employment only dips (when adjusted for housing completions which is the better metric for discussing construction employment) modestly after growing at a good rate up to that point.

This makes it appear as if there is no notable net reduction in borrowing related to construction, and neither does it appear that banks earnings were down during this period.  BoA's earning in 2007 were higher than 2004 or any year prior to that and Wells Fargo's 2007 earnings were higher than 2005 or any year prior.  Its all so counter intuitive or simply non intuitive that you can almost forgive monetarists who believe that you need higher interest rates to create inflation. 


Saturday, October 13, 2018

The Yield Curve part 1

See if you can spot the flaw.

1.  Printing money lowers bond yields  More money chasing the same number of bonds means borrowers pay lower interest rates.

2.  Printing money raises bond yields.  More money pushes up prices of all goods, ie inflation, inflation reduces the real value of bonds pushing up rates.

How about

1.  Higher real rates of return increase savings.  Better yields mean the opportunity cost ratio of saving vs spending shifts towards saving.

2.  Higher real rates of return decrease savings.  Better yields means less money needs to be invested to hit retirement goals, leaving more for consumption.

Let's try empirically on the first count.


No obvious correlation between shifting the Fed Funds rate and inflation expectations. 


And no obvious correlation between 30 year mortgage rates.  Rather than post 10 more graphs let me just say that I see no obvious connection between inflation expectations or current inflation rates and bond rates, or changes in the monetary base or currency in circulation. 

At one point the term inflation meant "an increase in the money supply" and now it generally means "and increase in prices due to an increase in the money supply".  The only thing that this clarifies is that you can't get very far using definitions. 

**************

Going back to the yield curve, a couple of posts ago I criticized the claim that an inverted yield curve was a causal agent in creating recessions because it reduced the incentive to lend which caused a drop in lending which causes a drop in economic activity.  This doesn't make sense for a few reasons, first there isn't any evidence in 2006 of a drop in lending when the curve inverts, nor as it is narrowing.  Secondly a drop in lending should push the long term rates up preventing or at least pushing a reversion of the curve (obviously this won't happen if lending does dry up, but its a logical hole in the argument) and finally because recessions have tended to start after the curve has started reverting. 

The best correlation in terms of both timing and logical causal power for the 2007 recession is the delinquency rates for commercial and residential property. 


To preempt some arguments.

1.  "Of course delinquencies rose, people lost their jobs and couldn't make payments". 

Delinquency rates start to rise before the UR rate, and before GDP starts to fall. 

2.  "The Fed pushed up short term rates and that caused adjustable rate borrowers to not be able to afford the payments". 

The Fed raised rates from mid 2004 through mid 2006 and held them there until mid 2007 when the starting cutting.  Delinquencies start rising in 2007 so 3 years of higher rates didn't cause an increase, and the most common adjustable rate mortgages (ARMs) are 5 and 7 year lock ins, so those people wouldn't have been hit unless they took out their mortgages between 2000 and 2002.  Anyone who did so would have been a favorite to sell their house at a large profit in 2007 rather than default as prices would have risen.  Additionally long term rates only moved up about a point to a point and a half, meaning a refinance at that time or paying the higher rate shouldn't have been wildly onerous. 

Only really short term borrowing for houses, 1 or 2 year ARMs and interest only loans, should have been at risk for sudden defaults.  In other words bad lending standards.  Commercial properties are more complicated to investigate but the conclusions are roughly the same, places that couldn't make payments weren't failing to do so because of the Federal Funds rate increases.

You also have a decent correlation on the back end with the peak of commercial properties right at the end of the recession and the peak of housing coming 9 months later, and the decline in the UE rate going along with the declines in delinquency rates. 

Lets put the YC in with delinquency rates


I left the 2001 recession in to show that the rise in delinquency rates isn't a theme common to all recessions. 

We see again that delinquencies lead, but the time the Fed pushes the YC above zero in mid 2007 the delinquency rate has already hit 2.5%, a high for this chart.  This makes sense, the Fed is reactionary and isn't going to start lowering rates on a whim, it is going to wait until it sees something in the data that needs responding to. 

This is a longish and roundabout way to get to the conclusion that the YC reversion is not causal of the recession and that the Funds rate level changes are of limited importance for most recessions by this point. 

Monday, October 1, 2018

Rising Interest Rates part 2

The first part was getting fairly long, so here is part two on rising interest rates and government debt.

The Federal Reserve is currently planning on two related courses of action in the near future, first to continue unwinding portions of its balance sheet and secondly to steadily increase interest rates and tt is difficult to see how they could accomplish the former without the latter occurring. Unwinding the balance sheet should have a dual effect on pushing up rates, first it increases the available supply of securities as they are functionally off market, and secondly should lead to lower remittances to the treasury, increasing the deficit and increasing the supply of Treasuries.

Here I am going to split the federal funds rate into two eras, 1950s through the early 1980s and the 1980s through present day


Here we have rising interest rates where almost every peak or trough is higher than the previous peak or trough up until the early 80s when we get declining interest rates where almost every peak or trough is lower than the previous peak or trough. The switch from rising to falling interest rates concurred with a dramatic shift in Fed policy. Functionally the full employment mandate was ignored for a period in the name of price stability and the funds rate was increased dramatically. As the Federal Reserve is giving no indications of a major departure from current policy I conclude that the current rising interest rate trend will be similar to the trend from the last 35+ years. Thus I expect the current rise in interest rates (as measured by the federal funds rate) to peak below the 5.25% that saw for parts of 2006 and 2007. My best guess is that it will peak under 4%, but my investment decisions will not hinge on this guess, merely be optimized somewhat in favor of it.


While Treasury rates should follow the direction of the federal funds rate there is a good chance that shortish term Treasuries will rise somewhat faster, in fact to an extent they already have.


Here we see that 1 and 2 year Treasury rates have increased by about 25% more than the funds rates since 2013 . We can also see that this happened around 1993 and 1999. That the Fed intends to wind down their balance sheet in the near term increases the chance that short term Treasury rates will rise faster than the funds rate.

Here I want to revist something I have mentioned a few times, but in more detail, that the rises in short term interest rates aren’t pushing up long term interest rates.


The Blue line is the spread between the 30 year mortgage and the federal funds rate, and the red line is the 30 year mortgage rate. Remember that the low points for the blue lines are when the spread is very small, and you can see that the spread decreases dramatically several times without much (or any) push up or down in long term rates. As long as this pattern holds (and it isn’t guaranteed as this is not the pre 1980s pattern) this should mean that short term rates peak at under 5%, and probably under 4.5%, before the Fed starts cutting into the next recession.

This is the good news for government debt, the rise in interest rates shouldn’t become a rocket and the duration won’t be for so long that all government debt feels the rise. On the other hand the federal government has been getting less good about piling on debt.


And a shift in long term rates