Saturday, November 19, 2022

2000s Housing Price Drop

  We are sixteen years past the price peak of the 2000s housing bubble and people are still coming up with explanations for those outcomes while ignoring really basic and easy to find and verify facts.  Arnold Kling links to this post here which includes the statement

What makes things especially tricky for the Fed is that the housing market is much less liquid than other major assets like stocks or bonds. It takes a couple of months for someone to sell their home, and then another month or two for sales to be reflected in national statistics. As a result, home prices tend to have more momentum than other assets. Once prices start to fall, they tend to keep going in the same direction.


The use of the term momentum here is bizarre, and requires a very strange definition to allow it to be correct.  Using Case-Shiller housing prices peaked in 2006 and bottomed in 2012, but the term momentum doesn't describe the action at all.  The fall was steady at first, accelerated during the second half of the recession and then was slow with multiple upturns for the final 2 years.  


We see 3 false bottoms during the final 3 years of the decline.  The behavior after the peak is a fairly straight forward story of supply and demand:  During the run up in prices* supply was outstripping demand as to much housing was built.  The evidence here is simple- vacancy rates were rising as prices were rising


At the peak we didn't just have to much housing supply there was a pipeline of unfinished projects which were in some phase of starting but not completed that were put on hold.  As prices started to stabilize those projects were completed, boosting supply and damping down prices again.  We can see that in the starts minus completions data


Starts logically have to precede completions but from 2006 to 2011 the US was finishing hundreds of thousands of more units than it started.  This is the tail end of the overbuilding that was occurring during the mid 2000s, and the price bottoms very shortly after we have burned through that overhang in 2012 where completions are dominated by starts again.  A straightforward supply and demand rebalancing gets us most of the way to understanding the price action after the peak in 2006.  

We have no such clear market behavior right now.  The eviction moratorium and stimulus checks have skewed demand making the very low vacancy rates difficult to trust.  I can confidently say that those two things are pushing housing demand higher but the magnitude is not easy to pin down.  What ever the outcomes today they won't be driven by the same factors as occurred in 2006, and certainly not by vague assertions of 'momentum' based on how long it takes for a house to list and sell.  

*This explanation is skipping over the how of increasing prices in concert with increasing supply which is the more interesting question.


Wednesday, October 23, 2019

S&P straddle

Purchased a call for SPY 303, November 29th and a Put for SPY 293, same expiration. 

Tuesday, October 8, 2019

Habit vs incentive

Ask a generic economist about the importance of a significant down payment for the housing market and they will reply with something about homeowners needing skin in the game so they don't bail at the first sign of trouble, and/or as a protection for the lender.  This ought to have gone up in smoke during the financial crisis as many of the defaults and write downs came from homes with large down payments and well documented incomes.  The primary tool of the large down payment is as a selection mechanism, and the slashing away at that mechanism was a major factor in the run up in prices. 

The basic principle is simple, if you can save a significant sum of money then you are a much better risk for a loan than someone who doesn't. Home ownership via a mortgage comes with a double whammy, first you have structured regular payments for the mortgage, insurance and property taxes, then you have lump sum costs for repairs.  A new roof, leaky pipes, broken windows, some large some small but persistent and sometimes lumpy.  In short once you buy the house and commit to the recurring costs and dump your savings into the down payment you need to start saving again to handle these costs.  This is where habit comes in, who is more likely to be able to maintain the house (ie the collateral), the one who saved 20% of the purchase price or the one who didn't?  The answer is obvious.

Rising home prices didn't break the truism, but it did muddy the waters a lot.  Having a 20% down payment could still have been due to a high savings rate, but it also could have been due to luck.  If you bought a $100,000 house with 20% down early in the 2000s and home prices pushed its 'value' up 50% over the next few years then you could sell your house and have ~$70,000 available for your next down payment which would qualify you for a $350,000 loan (obviously your income might not) on the next one.  Or you might have borrowed against that 50k in new equity and purchased a second house as a rental/vacation home/speculative asset.  This is a very different situation than a person who bought a house, and then over several years saved up another down payment worth of cash.  In both cases there is an incentive to keep the 2nd house with the down payment, but in one case you have a buyer who clearly was living below their means for several years and another case where it is unclear if they were or weren't. 

During the financial crisis one of the largest segments for defaults was second homes purchased with normal down payments, which I believe was largely caused by the rise in home prices distorting the signal that a down payment usually brings. 

Monday, September 23, 2019

Liquidity something

The big news from this past week was the Federal Reserve's sudden re-entrance into the overnight repo market, and adding liquidity.  First question is was this a demand spike or a shortfall of supply?


No real demand spike, but a persistent decline in excess reserves has been decreasing the available supply.


 Supply is also short in another sense


It seems unlikely that there is no maximum level of debt for a country, be it government, private or combined.  Obviously it would be shifting based on factors such as interest rates but conceptually it is hard to argue that debt to gdp ratios can go up indefinitely, and it is likely an empirical answer you will get. 


So here we are, a major financial crisis that started with massive debt levels and 10 years later those levels are roughly the same.  We have now a strong policy of government stimulus in the face of recessions, with 2008 starting with a little remembered 110 billion dollar stimulus before a recession was officially recognized which came 7 months after the Fed started an easing cycle.  Who is going to get hit this time if debt is increased?


To maintain the current level of total debt there will have to be a reduction to offset any government stimulus.  The price rise you see above should be viewed even more skeptically than the one up until 2007 because it is on lower volume.  Below is existing home sales (had to change sources)

United States Existing Home Sales

Plus new home sales


We are looking at significantly lower volume, significantly less dollar value to gdp for mortgages in a larger country (in real prices the peak isn't as high as the previous peak though).


If this next recession is significant, with significant additional government debt I would expect home sales volume to die, and when volume dies volatility explodes. 

Thursday, August 29, 2019

Closed all shorts

Closed all shorts at significant losses.  Currently anticipating markets to rise for next 6 months, considering going long. 

Monday, August 5, 2019

perspective

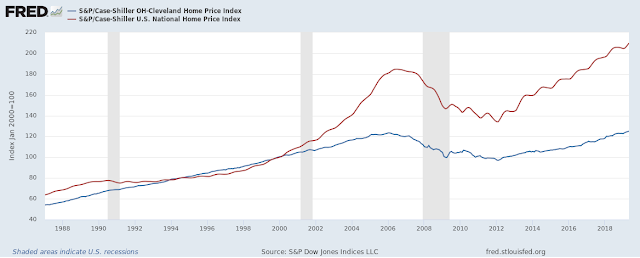
Some people describe the housing bubble of the early 2000s as being isolated to a few major cities, their outsized effect being what drove the events that unfolded.  Smaller cities, such as Cleveland Ohio, had much smaller run ups, and smaller busts.  As usual this is a matter of perspective.


The two series diverge in 2000, with the national series running up 85% to the Cleveland series 23%, the declines are actually reasonably close though with the national rate dropping by ~ 27% peak to trough and the Cleveland series dropping ~22%.  From that perspective the national average had a larger run up and decline, however from another perspective Cleveland lost all of its post 2000 gains with its index dropping back to 1999 levels, while the national average pushed back to only around 2003.  The rebound has also been dramatically in the National averages favor with the 2006 peak being matched in 2016 and a steady rise after that while Cleveland only recently matched its 2006 peak.

The other perspective is then that without the housing bubble Cleveland's home prices would have been flat or falling while the national average would have been rising, albeit more slowly and that the impact on Cleveland was larger because the difference between a rising and falling market is much greater than the difference between a rising market and a market that rises at a higher rate.

*****************

I like thinking about different ways you can explain the yield curve, one way is to use the Cleveland perspective.  That is the difference between getting a 30 year bond at X rate or a 20 year bond at a slightly higher rate is small compared to getting out of equities during a rise and getting out of equities during a fall.  If you are jumping out of the way of a steamroller it doesn't matter much if you jump into a bramble patch, even though that bramble patch is far inferior to a manicured lawn because 99.9% of your desire is simply not getting crushed.