First Japanese GDP deflator
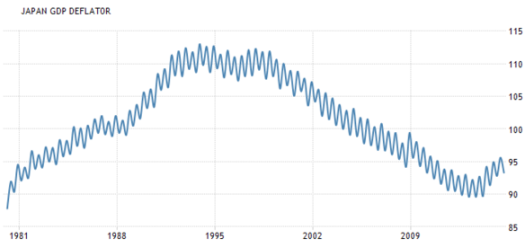
Quick eyeball description. Inflation from 1981-1993, no inflation from 1994-1998, deflation from 1999-2013 and inflation from 2014-2015.
Japanese UE rate
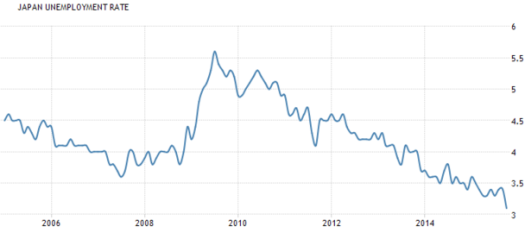
What is the correlation between inflation and the UE rate with the information given? We have two periods of declining UE rates, both of which occur mostly under deflation, one period of rising UE, under deflation, and one period of inflation with declining UE (eyeballing looks like the same trend in decline that it had under the previous deflationary regime).
What happens if we take UE under the full range given to us by the GDP deflator graph?

Correlation between inflation and UE in Japan = none.
What is Sumner's conclusion about Abenomics?
Which leads to obvious questions: who gets credit for the drop in the UE rate from 2010-2012 (Abe's party wins an election in late 2012) under deflationary pressures? Why is there no apparent change in the decline in UE rate after Abe is elected? Or again after the CB started targeting 2% inflation?I thought the monetary “arrow” would be a modest success, as they were on the right track but not doing enough. In fact, so far the monetary arrow has been an overwhelming success, beyond almost anyone’s wildest dreams.