Friday, August 19, 2016

It can't all be money

I'm only two years behind on this debate about fractional reserve banking.  Since I am writing for no one I can summarize it very quickly.  John Tamny says that the money multiplier doesn't exist and Warren Gibson says that it does.  As usual the answer comes down to definitions.  Warren Gibson says that credits in your checking account (or anything part of M1) is money-

Most definitely, because it fits the definition perfectly: a generally accepted medium of exchange

I will focus on the last 3 worlds of this line, but first a silly example.  Suppose the Federal reserve prints up trillions of dollars worth of crisp, clean bills.  It packs them on trucks, ships them down to Cape Canarveral, loads them onto a shuttle and blasts them into space where it escapes the Earth's orbit and sails away into the cold, black emptiness of space.  Is this money?  It all looks, feels and matches the legal definition of money back on Earth, but how would it effect the prices of goods and services?  The obvious answer is that it wouldn't, and so the economic answer is that it isn't money.  What if the Fed printed that money, but then locked it in an underground vault and held it there never intending to use it?  Same answer, so when we talk about money part of the definition has to be about the accessibility of that money.  On to fractional reserve banking.

Adam takes $100 and deposits it in his bank, his bank says "come back anytime and get it", then lends $90 out to Bill who deposits that $90 into a different bank.  This bank also says "come back anytime and get it", and then promptly loans out $81 to Charles, and so on and so on.  If you take the sum total of everyone's bank account once the process has completed there would be $1,000 totaled across them.  This is where Warren Gibson gets the idea that the "money supply" must be $1,000, Tammy is a finance guy though, so he looks at the broader picture.  Every dollar created after the initial deposit is an asset and a liability.  When Adam's bank makes the $90 loan they create a $90 asset, but the also saddle themselves with a $90 deficit that they owe to Adam.  Back to accessibility.

Can $1,000 be withdrawn from the banking system and be spent?  No.  If Adam withdraws his $100, then his bank has to run to Bill and demand their $90 back (assuming all deposits and loans are callable at any time), Bill runs to his bank to withdraw the $90, who has to run to Charles to get the $81.  No matter how you slice it only $100 can be withdrawn from the system and then spent on goods and services, and there is no way to get the effect of $1,000 on goods and services.

This is exactly the effect that full reserve Austrians cite when they state that Fractional Reserve Banking is fraudulent, there is no way for all people in the line to effectively use their individual deposits.  If some guy in the middle of the chain withdraws his $50 to spend then that immediately prevents Adam from ever accessing his full $100, while also calling in every loan made beyond that $50 deposit.

As far as empirical (anecdotal!) evidence, I think it is on the side of Tamny.  Japan has a massive public debt, which has been building for a few decades now, the level of reserves held by the Japanese Central bank have exploded, and yet the only inflation seen in the immediate past was a short term blip when the sales tax increase went into effect.  If M1 is money, if government bonds paying near zero are also money (which flows from the same definition as Gibson tries to use) and if inflation is due to increases in the money supply, then you can't escape the prediction that Japan should be crumbling amid hyper inflation.

Thursday, December 10, 2015

Inflation and UE in Japan

Two graphs presented by Scott Sumner

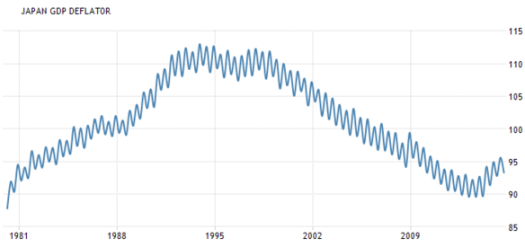
First Japanese GDP deflator


Quick eyeball description.  Inflation from 1981-1993, no inflation from 1994-1998, deflation from 1999-2013 and inflation from 2014-2015.

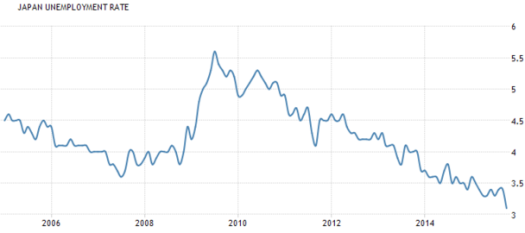
Japanese UE rate

Quick eyeball description.  Declining UE from 2005-2007, flat UE from 2007-2008, rising UE in 2009, declining UE from 2010-2015.


What is the correlation between inflation and the UE rate with the information given?  We have two periods of declining UE rates, both of which occur mostly under deflation, one period of rising UE, under deflation, and one period of inflation with declining UE (eyeballing looks like the same trend in decline that it had under the previous deflationary regime).


What happens if we take UE under the full range given to us by the GDP deflator graph?
Now we also have rising UE from 1981-1988 alongside inflation.  In a matrix of inflation, deflation, rising UE and falling UE there are 4 combinations (ignoring flat for both).  We see all 4 combinations over a 35 year period in these graphs.
Correlation between inflation and UE in Japan = none. 

What is Sumner's conclusion about Abenomics? 
I thought the monetary “arrow” would be a modest success, as they were on the right track but not doing enough.  In fact, so far the monetary arrow has been an overwhelming success, beyond almost anyone’s wildest dreams.
 Which leads to obvious questions: who gets credit for the drop in the UE rate from 2010-2012 (Abe's party wins an election in late 2012) under deflationary pressures?  Why is there no apparent change in the decline in UE rate after Abe is elected?  Or again after the CB started targeting 2% inflation? 

Wednesday, May 6, 2015

Low Interest Treasuries

Here is a typical description of a liquidity trap from an economist

Think of a liquidity trap as a situation where investors view central bank money and treasury debt as perfect substitutes. Such a condition likely never holds exactly in reality, but that's neither here nor there. Empirical relevance is possible even if liquidity trap conditions hold approximately. In any case, if money and bonds are close to perfect substitutes, then the composition of total government debt (between money and bonds) has little economic significance (in the same way that the composition of the money supply between $5 and $10 bills does not matter).
 This is just one of many examples out there discussing the implication of very low interest rates on bonds.  What I have never seen from these same people is a discussion on when exactly, or even generally bonds become money-like, and the implications on evaluating monetary policy prior to 2008.  I am going to run through this pretty sloppily, the assumptions and numbers here are to get a feel for the scale, and not to put a final number or even range on it.

I doubt that anyone would defend the position that bonds are 0% like money at 0.001% and an almost perfect money substitute at 0.000%.  Nor do I think that anyone would defend the position that bonds with a 20% yield are good money substitutes (though under some conditions they might be, but for now I am talking about the US from 2000-present). 

So my first assumption is that the moneyness of bonds starts to become significant around a 2.5% yield.  This is somewhat arbitrary, but a defensible starting position.  The Fed has an inflation target around 2%, which makes bonds paying that rate or less (expected) losers in real terms.  If there is an inflection point where bonds start to become more like money the expected inflation rate is a reasonable guess as to that point.  I use 2.5% because inflation had typically been above 2%, and because it makes it nice and easy with the fed dropping rates by a quarter point at a time along with assumption #2. 

Second assumption, debt is distributed pretty evenly by duration.  Short term bonds should cover 8-10% of all debt in the US, and only publicly held debt matters for this exercise.  I am going to use 10%, and the US had a publicly held debt of between 3.5 and 4.0 Trillion dollars from 2000-2003.  So 3.75 trillion for an average. 

So starting with bonds being 0% money at 2.5%+ and becoming 100% money at 0%, each drop of 0.25% represents 10% more "moneyness" (yes, laziness and linearness, they go arm in arm)- which effects 10% of the total debt.  So a 0.25% drop below 2.5% means 1% of total publicly held debt becomes money.  1% is 35-40 billion dollars. 

Using the Federal funds rate (monthly data)- October 2001 was the first breach of the 2.5% fake barrier since 1962.  The rate fell to 1%, so the BotE calculation implies a 210-240 billion dollar increase in the money supply over that time period.  To put that in perspective the adjusted monetary base went up by less than 200 billion dollars during that time period.  This effect, if real and within half an order of magnitude of this calculation would mean the Fed loosened during this period 2 to 4 times as much as conventional estimates. 

What else does it imply though?  Well when the Fed started raising rates in Mid 2004 they were tightening twice as much as conventional estimates (until the rate broke 2.5%, then it magically stopped). 

The real kicker though comes in 2008 when the Fed again drops below 2.5%, because total government debt was 50% higher in 2008 than in 2003 the effect would be ~50% higher.  So a 50-60 billion dollar increase per 0.25% rate drop.  By the time the Funds rate was bouncing around below 0.25% in December 2008 this effect would have added $600 billion dollars or so in "money" in addition to the $800 billion or so the monetary base increased.

The final implication is even more dramatic as federal debt held by the public has shot up to almost $13 trillion in 2014.  That would be another $700 trillion in money "created" on top of the $1.6 trillion added to the monetary base.

This seems to me to be a very straight forward consequence of the idea that bonds and money are excellent substitutes near the zero bound.  You can argue against some of the methods I used, for instance you could disagree with using the federal funds rate instead of actual US Treasury rates, or disagree with the %s used.  Those disagreements would only effect the timing and magnitude of the loosening/tightening, and not the core concept. 


Thursday, March 5, 2015

Information

One thing that bugs me to no end is the generic assumption that we can tease out tons of information from prices, this is probably mostly a rant piece so feel free to ignore (all zero people that read this blog).

Point 1.  You can only figure out default probability by comparing interest rates to some neutral asset.  Say, for example, you wanted to guess at the implied default rate of a bond put up to build a new casino in Vegas.  You take that bond and subtract out the interest rate for a T-Bill of similar maturity and you have a decent idea of what that bonds default rate is relative to the T-Bill.  This ONLY works because you are assuming the failure of 1 hotel in Vegas doesn't cause a noticeable change in the probability of default of the US.  Duh.  Everyone knows this.  Except tons of people don't follow this advice when discussing the default rate of T-Bills.  I have read, in various comments and blog posts, probably dozens of different times some variation of "the market doesn't seem worried about a US default seeing as they are only demanding x% interest rates to compensate".  So here is the question- what would you want to hold if there was a default in Treasuries?  Cash?  Where are we putting trillions of dollars in cash, because the US banking system is backed both explicitly and implicitly by US bonds.  If there was a default the FDIC would not be able to cover any substantial failures without turning to the treasury who wouldn't be able to borrow. 

Point 2.  A market price only tells you about what market participants think.  The TIPS spread only tells you about inflation expectations of people that actively buy treasuries, and who think that TIPS are an excellent way to play high inflation expectations.  If Gold cranks generally aren't buying TIPS when they think inflation is around the corner, they buy gold.  It doesn't matter if you think they are nuts or not, if you call you position "market monetarism" but exclude portions of people you disagree with, guess what- you should be dropping the "market" portion of your name. 

Monday, February 9, 2015

Micro vs Macro

The difference between studying micro- and macro-economics is the difference between being easily influenced and easily influencing others.  In micro-economic studies you are looking at a small scale event, and so you can generally assume that most variables don't change much due to the event because if its small size.   Micro could be called the "all else equal" discipline because the stability of the greater economy allows you to isolate variables.  The converse is also true, you wouldn't want to conduct a microeconomic study in France from 1938-1950 because world events would dominate the data.  Macro studies should be focused on the opposite, macro events are (by definition) large and impactful, and thus macro investigation should be mostly about the feedback relationships caused by the event.  The obvious differences in how an event should be analyzed due to its size doesn't stop the overwhelming majority of experts on macro from using the tools that should be reserved for micro.

In a recent blog post Paul Krugman "investigates" the question- will a recently strong dollar be a drag on the US economy?  Let us skip to the last few paragraphs of the piece (emphasis mine).
In case #1, everyone sees the relative strength of US spending as temporary – either they see it as a one-time blip that will go away, or they expect the rest of the world to exhibit a similar surge in demand in the not-too-distant future. In that case the dollar doesn’t move, and the bulk of the demand surge stays in the US.
In case #2, everyone sees the strength of US spending relative to the rest of the world as more or less permanent. In that case the dollar rises sharply, effectively sharing the rise in US demand more or less evenly around the world. It’s important to note, by the way, that this is not just ordinary leakage via the import content of spending; it works via financial markets and the dollar, and happens even if the direct leakage through imports is fairly small.
So, what’s actually happening? The dollar is rising a lot, which suggests that markets regard the relative rise in US demand as a fairly long-term phenomenon – which in turn should mean that a lot of the rise in US demand ends up benefiting other countries. In other words, the strong dollar probably is going to be a major drag on recovery.

 You can read the rest of the piece to see that I am not taking anything out of context, but I will note that Krugman is specifically referring to a case where a country is at the zero lower bound to avoid any accusations of unfairness, though I don't think the distinction matters here.

Let me demonstrate the absurdity of the conclusion by extending the two scenarios into a future a little bit more while holding everything else constant.  In scenario 1 demand in the US rises relative to the rest of the world, and then falls back.  One way that this could happen is that there is an increase in demand in the US, with world demand staying at the same level, and then US demand declining.  Keynesians have a word for the decrease in demand, recession.  In the second scenario we would concluded that continually rising demand would cause a continually strengthening dollar.  Keynesians also have a word that starts with the letter R to describe a sustained increase in demand, recovery!  It gets stranger for the longer and stronger the growth in demand was in the US the stronger the US dollar would become, and so the more of a drag the dollar would become on recovery.  To sum up this position as succinctly as possible- a recovery (increase in US demand) will be "a major drag on recovery".

This is the extent to which micro style analysis (holding most of the world constant) can pervert your thinking in application to macro events.  Keynesians are probably the most frequent culprits of this type of error as their approach is extremely model heavy. Everything has to be aggregated and everything has to be expressed in a 1+1 = 2 type of way.  When their model predictions fail they are left reverting to "the world is different because of X", under condition A we use model B, under condition C we use model D, as we see in this piece as we swap from a normal time to a period at the zero bound.  What is conveniently ignored  is that policy makers lean more heavily Keynesian (not Keynesian enough! the cry always goes) than any other direction.  It is the adherence to model B that leads to the conditions where it no longer works.

Wednesday, February 4, 2015

Nick Rowe gets lost taking a shortcut

Nick Rowe is like the anti Tyler Cowen- lots of content, no links, tons of interaction with his commentors which explains why he will never be (wildly) popular. Marginal Revolution is the something for everyone (well everyone who likes econ) blog while Rowe's posts at Worthwhile Canadian Initiative are for everyone that wants to spend half an hour thinking about his simplest post- and trying to write a 2 line intro to a piece has totally distracted me and now I am looking up econ blog rankings.... why am I so easily dis . . .  hey look a ball!

So Nick Rowe has a post - if you want to get the specifics you should read his blog. I mean honestly if you aren't related to me and simply trying to monitor my mental health state surreptitiously (I am on to you!) you shouldn't be reading this blog unless are already reading his.  So let me skip beyond a summary and get to a point already.
But that's not all there is to it. Because the demand for my autographs will also depend on whether people expect they will appreciate or depreciate in value.
Suppose the current total market value of my autographs is $100 (10 autographs at $10 each). If I want to shrink it to $50, all I need do is threaten to produce autographs in unlimited amounts if the total market value ever rises above $50. And I must be prepared to carry out my threat, to make it credible. By printing autographs at a faster rate I make them depreciate in value at a faster rate, which reduces the demand for my autographs, which reduces the total market value of my autographs.
And then later
Bits of paper with my signature are just like bits of paper plastic or silicon with the signatures of Stephen Poloz and Carolyn Wilkins (Governor and Deputy Governor of the Bank of Canada). Except we measure prices of everything else in the latter and not in the former, so a fall in the price of my autographs is equivalent to a rise in the price of everything else in terms of their autographs. And we use the latter but not the former as a medium of exchange (which is why the latter have a demand curve where quantity and price are inversely proportional).
As it happens I was recently talking to someone who was concerned with high inflation in the future, and his reaction to this worry is to increase his demand for money right now.  Crazy, right?  No, because he is on the verge of retiring and in his view dying with a million dollars in the bank is a far better outcome than living for 5 years broke, struggling and feeling like a burden on his family.  In financial terms he has asymmetrical risk.

Much of our modern economy is exposed to asymmetrical risk, banks in particular are heavily exposed to the risk of future inflation.  Lets say as CEO of a bank you are hosting a huge party to celebrate $100 billion dollars in loans, when a top financial analyst run into the room and whispers in your ear that he has crunched the numbers and, gasp, inflation is going to be 2 percentage points per year higher than you thought over the next 10 years. What, besides snide remarks about run on sentences, is your plan for future loans?  Obviously making more loans at the current rate is out of the question since you are just increasing your exposure, and you will need a healthy cushion so you can maintain your reserve ratio, and finally you want a large cash hoard to loan out after inflation has hit (and interest rates have gone up) to rebuild the portfolio and cover the losses on loans made recently.

What does this look like from a CBs point of view?   Demand for money seems to have risen, so now the CB prints (or promises to) more money, which should push our bank to expect even more inflation, so it hoards more.

What happens in the economy?  Mortgages are harder to come by, either they have higher interest rates or they are simply unavailable.  Either way home prices decline and people who are selling homes either have to pay for two places to live or take a lower price, so their consumption is likely to be cut back to compensate (people buying at "lower" prices but higher interest rates aren't gaining much, if any, purchasing power, and those that want to buy but can't- its difficult to say).  Now we have a liquidity crisis because the bank is hoarding and we have lower measured inflation due to lower consumption (and possibly just through lower housing prices depending on how housing is included), so what is a CB to do?  Why, print more!   Promise more inflation!  Scare the bank more!  Make the bank hoard more!

I put an unstated assumption in here to make it work- that inflation can happen with a lag.  Nick Rowe puts the opposite assumption- that inflation is close to immediate (we both simplified a lot as well).   The point here isn't to aruge that my scenario is correct and his isn't, it is to identify that Nick's is dependent on simplification, that there isn't a lag in inflation, that there aren't third parties exposed to moves in the prices of his autographs and a whole bunch of other (likely) things.

Monday, February 2, 2015

IOR part 2

IOR 1 is here

In IOR 1 I laid out a pretty basic outline for when interest on reserves would be inflationary/contractionary, here I am thinking about practical implications for Fed policy.

If the Fed wants to use IOR as a tightening tool we have to expect that inflation or expectations of future inflation are getting to high.  Since the Fed seems perfectly happy with inflation in the 2-2.5% range I assume it would take something more than that for them to try out a new program on a large scale (the Fed is frequently viewed as conservative, especially by MMs).  Also for it to impact inflation the transmission of price increases has to be primarily through bank loans, otherwise paying interest on reserves won't accomplish much if anything.

in 2014 the Fed remitted ~80 billion to the Treasury, and excess reserves are currently over 2.5 trillion dollars. Going back to IOR #1- IOR should expand the MS when payments exceed Fed profits (ie remittences)- so if the Fed tries to tighten with IOR it will start fighting itself with those ratios around a 3.2% interest rate.  The Fed isn't jacking up IOR anything soon according to its guidance, and its remittances have been relatively flat since 2010 while excess reserves have increased at over 300 billion per year during that span.  5 more years of those trends (Japanese "lost decade" range) and the Fed would be facing issues at a 2% rate, and another 5 years to 1.5%.  Japan is currently 25 years into an environment like this, which would put the Fed in a pickle before it hit the 1% mark.

Point #2 is that IOR is only effective if the rate is high enough to convince banks not to lend.  Well if inflation is significantly above 3% then deposit rates should be in that range, so banks are unlikely to willingly take less than that from the Fed to lend* as they would slowly be bleeding out even while getting "free money" from the Fed.

This isn't a definitive treatment, but it is a substantial blow to those who think the Fed should and could push for a return to trend growth.  A big push to get multiyear inflation (or nGDP if you prefer) above the historical trend to bring the curve back up is likely to put the Fed in position where its attempts to tighten lead to a larger money supply- and unlike most of QE a MS in which it holds no claims against.  If inflation were to push into the 4-5% range the Fed would be playing with fire and would risk losing control of the MS.

*The effective rate the Fed has to set to curtail lending will likely be higher than the deposit rate as the portfolios of banks will be heavily weighted to loans made over the past 5+ years with extremely generous terms to borrowers, and banks will have to make up those losses in the event of a substantial increase in rates.