Monday, October 22, 2018

"Real" Interest Rates


We are diving right into this one, no words to start, just a graph! 

Red line = Federal Funds rate, blue line = Federal funds rate minus 5 year expected inflation.

From July 2003 to June 2004 the Effective Funds rate is essentially flat at 1%, during this time inflation expectations increase by about 1 percentage point.  This represents roughly a 67% increase in the expected inflation rate, from around 1.5% to 2.5%.


What is the Fed to do?  Well, start raising rates of course.  The Fed raises rates over 4 percentage points from June 2004 to July 2006 while 5 year inflation expectations move up another 15-20% to their peak at just under 3% in early 2005.  Meanwhile at the 10 year break even rate


So 10 year inflation expectations peaks right before the Fed starts raising the funds rate, and then is in the 2.2 to 2.8 range right up until August 2008 (not shown here).  Another look


The spreads here are small, but functionally doubled.  Early in the graph 10 year inflation expectations are basically 0.35% per year more than 5 year at the widest points, given that 10 year inflation includes the next 5 years as well this implies that years 6-10 should have around 0.70% higher inflation than years 1-5.  That isn't a huge deal but it is notable when rates are in the 1.5-2% range.

What is a huge deal is that the Federal Reserve raise interest rates by 4 percentage points and inflation expectations are virtually identical after the last increase to what they were at the first increase and were slightly higher for good portions of the rate increases.

If you are of the opinion that the Federal Reserve can control inflation (expectations) with the funds rate then you are looking at a 400% increase over 2 years to stop inflation expectations from rising.  And don't give me "long and variable lags", these rates include the 10 year break even rate which stops rising BEFORE the 5 year rate does.

There is a sentiment to be found that the Fed was to tight during this period, that they either raised rates to far or held them up there for to long.  This is awkward to argue as the lower of the 5 and 10 year break even rates stays above 2.15% and they were both right around 2.35% when the Fed starts easing in 2007.  Then the Fed lowers rates by 3+ percentage points from July 2007 to May 2008 and inflation expectations stay in the range the Fed wants them to.

All of this is just a set up for


This is about as close to a smoking gun as you can have against monetarism or Keynesian economics, both of which rely on using real interest rates as a mechanism for driving down the savings rate and driving up the consumption rate to combat a recession.  First I will zoom out as far as the Fed data goes to show how poorly correlated real interest rates are with the savings rate


Now a zoomed in section from the financial crisis


The savings rate fell and held steady while real interest rates climbed.  There are multiple measures here of what a "real" interest rate should be, the 10 year bond rate minus 10 year expected inflation, the same for 5 and 5, 2 year bond minus 5 year inflation, 2 year treasury minus the current inflation rate, the federal funds rate minus 5 year inflation and they all show the same pattern.  Real interest rates climbed and the savings rate ignored them, then rates fell and the savings rate ignore them and then the early stages of the financial crisis started and the savings rate moved higher and quickly.  I'm not going to discuss the spikes here, just the trend, the savings rate went from around 4% in the early stages of the recession to above 5% in about 6 months and up to the 6-7% range with peaks above 7.5%. 

If you read my previous posts on the yield curve you would note that the stock markets started rising more rapidly right around the same time that real interest rates started rising during the above period, and not long before housing starts fell off a cliff.

I am going to return to my explanation of a bifurcated market, that there exists two (or several) different sets of participants with little cross venturing.  Low, and especially negative, real interest rates should benefit borrowers at a cost to lenders.  Higher rates should benefit lenders at a cost to borrowers, and lower rates vice versa but how many would be borrowers can benefit by switching to being lenders?  If you have a cash reserve and are thinking of borrowing because real rates are low then your cash reserves are going to suffer poor growth roughly equal to the gains you get by borrowing the money for a project rather than using your own.  Moving towards equilibrium is difficult in this way, which is why the channel of rising real rates encouraging savings and decreasing real rates reducing them is central to modern macro theories and why the above graphs are so devastating to them.


Monday, October 15, 2018

Yield Curve Part 2

In Part 1 I looked at the end of the Yield Curve (YC) inversion, when it is reverting back to the normal state of short term rates being lower than long term rates.  Here we are going to look at the early stages of flattening and then inversion.

To start with I don't think that there is much that is special about the curve inversion SPECIFICALLY.  Very flat curves are just as interesting (ie tricky to explain) as the actual inversion, and there is no correlation between the depth or duration of the inversion and the eventual recession.  The inversion in 2000 was much deeper than the on in 2005 and the 2001 recession was much milder than the 2007.  There aren't a lot of consistent explanations for why a flat curve with a 0.1% difference between the long and short rates is a completely different animal from a curve with a -0.1% difference (ie inversion). 


To begin with the blue line is stock market capitalization to GDP, which is not a commonly used metric.  I'm starting with it to head off one particular complaint and that is that inversions happen when the Fed raises rates and the Fed raises rates when the economy is doing well and markets should go up when the economy is doing well.  Market cap to GDP shows (to some extent) when increases in market value exceed increases in GDP.  Lets add in the Federal Funds rate


This graph is very awkward for traditional cause and effect explanations of how the Fed should work.  First the Fed raising interest rates is supposed to slow down the economy, secondly the Fed increasing interest rates on the short end should push long end rates up (this appears to be correct, only not close to a 1:1 relationship) and third increasing short rates should push down inflation.  The latter two combined should producer higher real returns for bonds (higher returns that can be locked in with lower near term inflation) which should make bonds relatively more attractive than stocks, and the first note should slow earnings for stocks. 

Basically the Fed increasing rates ought to lead to lower stock market levels not higher, but what we see is the opposite, increases in the funds rate see higher stock market valuations in both raw levels and relative to GDP terms. 


Housing starts generally are funded with short term loans when started with borrowed money.  For the last two recessions it looks like housing starts peaks and then falls (to varying degrees) when the YC inverts but it is hard to use cost of borrowing or bank spreads to explain this when the starts were increasing with a very flat curve in the late 90s and increasing with a sharp funds rate increase during the 2000s.  In the 2000s housing starts continue to increase for 18 months before declining dramatically.

You could argue that this supports the conclusion that an inverted yield curve really is a different animal than just a flat one, but I don't think this holds as a significant factor.  First new home starts in the 90s is more of a high plateau than a peak and the decline isn't steep and secondly total construction employment only dips (when adjusted for housing completions which is the better metric for discussing construction employment) modestly after growing at a good rate up to that point.

This makes it appear as if there is no notable net reduction in borrowing related to construction, and neither does it appear that banks earnings were down during this period.  BoA's earning in 2007 were higher than 2004 or any year prior to that and Wells Fargo's 2007 earnings were higher than 2005 or any year prior.  Its all so counter intuitive or simply non intuitive that you can almost forgive monetarists who believe that you need higher interest rates to create inflation. 


Saturday, October 13, 2018

The Yield Curve part 1

See if you can spot the flaw.

1.  Printing money lowers bond yields  More money chasing the same number of bonds means borrowers pay lower interest rates.

2.  Printing money raises bond yields.  More money pushes up prices of all goods, ie inflation, inflation reduces the real value of bonds pushing up rates.

How about

1.  Higher real rates of return increase savings.  Better yields mean the opportunity cost ratio of saving vs spending shifts towards saving.

2.  Higher real rates of return decrease savings.  Better yields means less money needs to be invested to hit retirement goals, leaving more for consumption.

Let's try empirically on the first count.


No obvious correlation between shifting the Fed Funds rate and inflation expectations. 


And no obvious correlation between 30 year mortgage rates.  Rather than post 10 more graphs let me just say that I see no obvious connection between inflation expectations or current inflation rates and bond rates, or changes in the monetary base or currency in circulation. 

At one point the term inflation meant "an increase in the money supply" and now it generally means "and increase in prices due to an increase in the money supply".  The only thing that this clarifies is that you can't get very far using definitions. 

**************

Going back to the yield curve, a couple of posts ago I criticized the claim that an inverted yield curve was a causal agent in creating recessions because it reduced the incentive to lend which caused a drop in lending which causes a drop in economic activity.  This doesn't make sense for a few reasons, first there isn't any evidence in 2006 of a drop in lending when the curve inverts, nor as it is narrowing.  Secondly a drop in lending should push the long term rates up preventing or at least pushing a reversion of the curve (obviously this won't happen if lending does dry up, but its a logical hole in the argument) and finally because recessions have tended to start after the curve has started reverting. 

The best correlation in terms of both timing and logical causal power for the 2007 recession is the delinquency rates for commercial and residential property. 


To preempt some arguments.

1.  "Of course delinquencies rose, people lost their jobs and couldn't make payments". 

Delinquency rates start to rise before the UR rate, and before GDP starts to fall. 

2.  "The Fed pushed up short term rates and that caused adjustable rate borrowers to not be able to afford the payments". 

The Fed raised rates from mid 2004 through mid 2006 and held them there until mid 2007 when the starting cutting.  Delinquencies start rising in 2007 so 3 years of higher rates didn't cause an increase, and the most common adjustable rate mortgages (ARMs) are 5 and 7 year lock ins, so those people wouldn't have been hit unless they took out their mortgages between 2000 and 2002.  Anyone who did so would have been a favorite to sell their house at a large profit in 2007 rather than default as prices would have risen.  Additionally long term rates only moved up about a point to a point and a half, meaning a refinance at that time or paying the higher rate shouldn't have been wildly onerous. 

Only really short term borrowing for houses, 1 or 2 year ARMs and interest only loans, should have been at risk for sudden defaults.  In other words bad lending standards.  Commercial properties are more complicated to investigate but the conclusions are roughly the same, places that couldn't make payments weren't failing to do so because of the Federal Funds rate increases.

You also have a decent correlation on the back end with the peak of commercial properties right at the end of the recession and the peak of housing coming 9 months later, and the decline in the UE rate going along with the declines in delinquency rates. 

Lets put the YC in with delinquency rates


I left the 2001 recession in to show that the rise in delinquency rates isn't a theme common to all recessions. 

We see again that delinquencies lead, but the time the Fed pushes the YC above zero in mid 2007 the delinquency rate has already hit 2.5%, a high for this chart.  This makes sense, the Fed is reactionary and isn't going to start lowering rates on a whim, it is going to wait until it sees something in the data that needs responding to. 

This is a longish and roundabout way to get to the conclusion that the YC reversion is not causal of the recession and that the Funds rate level changes are of limited importance for most recessions by this point. 

Monday, October 1, 2018

Rising Interest Rates part 2

The first part was getting fairly long, so here is part two on rising interest rates and government debt.

The Federal Reserve is currently planning on two related courses of action in the near future, first to continue unwinding portions of its balance sheet and secondly to steadily increase interest rates and tt is difficult to see how they could accomplish the former without the latter occurring. Unwinding the balance sheet should have a dual effect on pushing up rates, first it increases the available supply of securities as they are functionally off market, and secondly should lead to lower remittances to the treasury, increasing the deficit and increasing the supply of Treasuries.

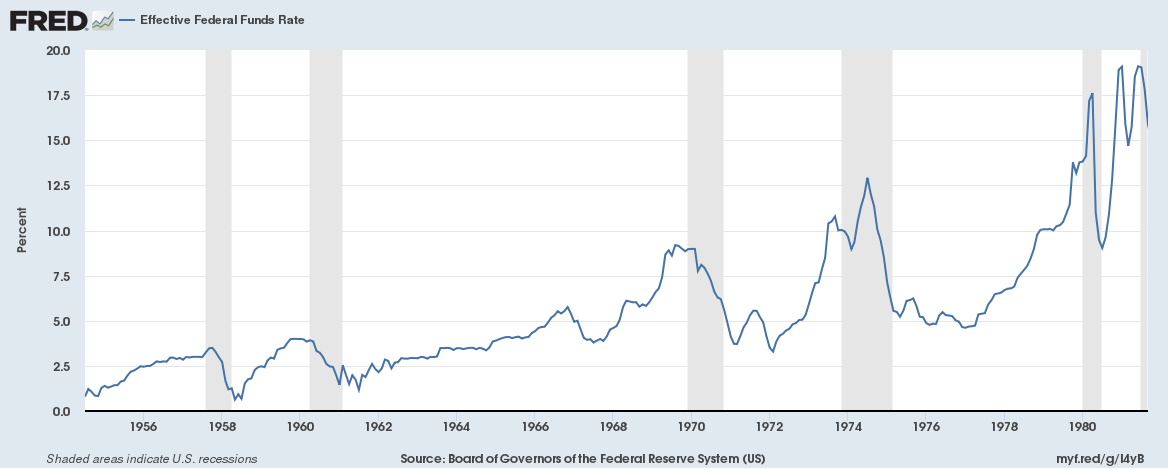
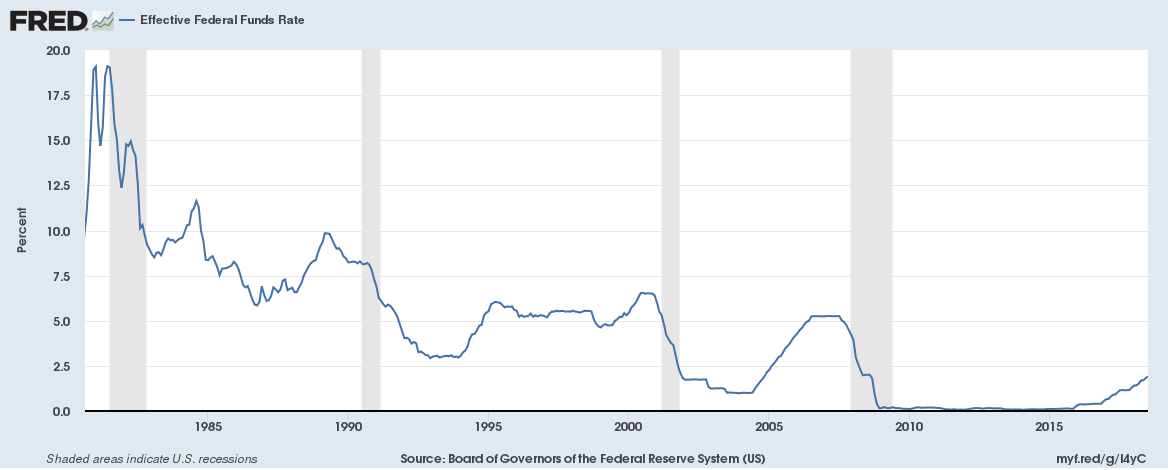
Here I am going to split the federal funds rate into two eras, 1950s through the early 1980s and the 1980s through present day


Here we have rising interest rates where almost every peak or trough is higher than the previous peak or trough up until the early 80s when we get declining interest rates where almost every peak or trough is lower than the previous peak or trough. The switch from rising to falling interest rates concurred with a dramatic shift in Fed policy. Functionally the full employment mandate was ignored for a period in the name of price stability and the funds rate was increased dramatically. As the Federal Reserve is giving no indications of a major departure from current policy I conclude that the current rising interest rate trend will be similar to the trend from the last 35+ years. Thus I expect the current rise in interest rates (as measured by the federal funds rate) to peak below the 5.25% that saw for parts of 2006 and 2007. My best guess is that it will peak under 4%, but my investment decisions will not hinge on this guess, merely be optimized somewhat in favor of it.


While Treasury rates should follow the direction of the federal funds rate there is a good chance that shortish term Treasuries will rise somewhat faster, in fact to an extent they already have.


Here we see that 1 and 2 year Treasury rates have increased by about 25% more than the funds rates since 2013 . We can also see that this happened around 1993 and 1999. That the Fed intends to wind down their balance sheet in the near term increases the chance that short term Treasury rates will rise faster than the funds rate.

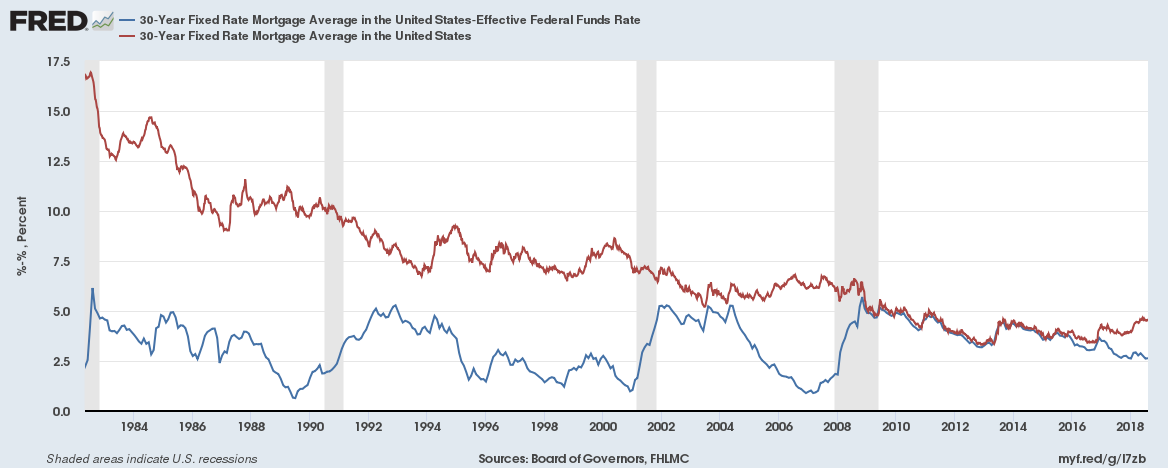
Here I want to revist something I have mentioned a few times, but in more detail, that the rises in short term interest rates aren’t pushing up long term interest rates.


The Blue line is the spread between the 30 year mortgage and the federal funds rate, and the red line is the 30 year mortgage rate. Remember that the low points for the blue lines are when the spread is very small, and you can see that the spread decreases dramatically several times without much (or any) push up or down in long term rates. As long as this pattern holds (and it isn’t guaranteed as this is not the pre 1980s pattern) this should mean that short term rates peak at under 5%, and probably under 4.5%, before the Fed starts cutting into the next recession.

This is the good news for government debt, the rise in interest rates shouldn’t become a rocket and the duration won’t be for so long that all government debt feels the rise. On the other hand the federal government has been getting less good about piling on debt.


And a shift in long term rates

Friday, September 28, 2018

Inverted Yeild Curve as a casual agent

Late in a post about the yield curve David Beckworth has a quote that is almost a throwaway line

An inverted yield curve means smaller net interest margins for financial firms and thus less financial intermediation. That is, once the yield curve inverts, it goes from being a predictive tool to a causal agent.

 There is a problem with this statement, it is hard to square with the actual economic outcomes.  For example the UE rate tends to drop or remain at low levels while the yield curve is inverted (UE rate is divided by 2 in these graphs to make it easier on the eyes).


The 2000 recession


And the early 1990s recession


Nor does the market show fears of a recession


If we look at mortgage originations by quarter or by year it is not obvious that the curve inversion of late 2005/early 2006 resulted in diminished financial activity, nor that the flattening yield curve in 2005 led to diminished financial activity (there is no reason to believe that an inverted yield curve reduces earnings significantly more than a flattened yield curve).  By year, for the 2000s, the highest origination amounts were 2003, 2005, 2006, 2004, 2002, 2007, 2009, 2001, 2008, 2000.  The largest yield curve spread was in 2004 and the smallest was 2006/2007.

So, looking at the Great Recession it appears that UE decreased, markets increased and mortgage originations stayed at high levels (certainly didn't decline) and the curve was inverted for most of 2006 through June 2007 which puts some counters out of the question (such as indicators lagging by several quarters unless by several quarters meaning 6+).

So what is going on?

With all the discussion about yield curve inversions almost no one bothers to mention the obvious fact that they are stupid.  They shouldn't happen.  Why would you lend someone money at 2% interest for 10 years when you could lend that same person money at 2.1% interest for 2 years? It takes some very convoluted situations to come up with plausible reasons.  I am happy to say though that it is hard to find market based curve inversions.  The 30 year mortgage rate doesn't dip below the 15 year rate as far back as FRED data goes and neither of the 30 year mortgage or 15 year mortgage ever dips below the overnight or 3 month interbank rates.  However the 30 year treasury does, meaning it isn't simply an artifact of a longer term on the high end.

So yields invert when Fed influenced rates climb without market influenced rates climbing an equivalent amount, eventually, after multiple rate hikes, the short end pops over the long end, but again only on securities that are influenced by the Fed, and we see no overt, short term signs of broad economic trouble. 

This means that there must be, somewhere, large frictions in the financial markets.  Why?  Well investors are trying to make money, if short term rates are rising relative to long term rates then people who lend at long term rates should move into at least some lending at short terms, and some people borrowing at short terms should prefer to borrow at long terms now.  These are strong pressures and they should be somewhat proportional to the size of rate changes.

Basically people (or institutions) who are happy to lend long aren't interested in lending short, and people who borrow short aren't interested in borrowing long.  Shouldn't an increase in short rates hit the market somehow though?  People who borrow short should see higher costs and reducing their borrowing which should filter out to the market.  Well there are basically three options that you have when a strategy isn't working, switch to an alternate method, pull out entirely and double down on the current one.  Clearly switching to alternate methods of funding hasn't been happening or the curve wouldn't narrow and then invert, pulling out appears not have happened after recent inversions leaving us with doubling down.

What would this look like?  If you are going to pay more for financing without a rise in long term profitability (ie flat long term rates) then you are going to need to add risk to boost earnings.   There are a lot of reasons why such a course might sound sensible, you expect short term rates to come back down and are just trying to weather the storm, or your compensation is strongly tied to the upside and only weakly to the down side, or any other number of situations.

This expectation fits very well with what we saw in 2005 through 2007, subprime loans (representing higher risk) almost doubled as a share of the market and increased by nearly 5 times in total dollars from the late 90s.  Adjustable rate mortgages (ARMs) roughly doubled from 15% to 30% of the market as well, fitting in with our hypothesis of greater risk taking by short term borrowers (banks).  This also fits the margin run up in the late 90s as the tech bubble peaked along with an inverted yield curve.  We can also start to formulate an explanation for the inconvenient truth that the Federal Reserve has been lowering interest rates (ie easing) into each of the past 3 recessions, getting "ahead of the ball" by a quarter at least without being able to prevent it with stimulus as is supposedly possible. 


 Here we have housing prices continuing to rise with Fed "tightening" and only leveling off when the Fed stops tightening and accelerating into the decline as the Fed "loosens" and its happening again


Eventually borrowed money has to be repayed, margins have to be satisfied.  The race up where you borrow to gain exposure turns into a race down where investors at first liquidate to realize gains followed by to late investors liquidating to prevent further losses, a Minksy Moment.  However, instead of relying on explanations based on greed (aren't people always greedy?) or hubris (aren't they always filled with this?) we have a rational explanation.  The Fed cutting rates makes the previous strategies profitable again with lower risk. 


Tuesday, September 25, 2018

Rising Interest rates part 1

Short term interest rates, be it Libor, the Federal funds rate, 1 month Treasuries have been rising for a little while now. Absent from most discussions is the simple fact that rising short term interest rates are bad for banks, the only thing worse for banks is rising short term interest rates coupled with stagnant or falling long term rates, quickly to illustrate.

Suppose you start a bank with $1,000,000 in capital, and have a 10% reserve requirement. You raise that capital at the short term market rate of 1% interest and you loan out the $900,000 that you are allowed to at 4% interest for 30 year mortgages. You’re bank is set to make 3% interest on $900,000 or $27,000 a year which then goes to paying for your tellers, security guards, property tax, and live goats that the bank president sacrifices to Moloch every third full moon to prevent defaults. Whatever is left is your profit, and since I am pulling numbers out of my ass lets say profit rates at this level are 1%.

What happens if short term rates rise to 2% in your second year? I’ll tell you what happens, you aren’t making money anymore, you are in fact just breaking even. If interest rates rise above 2% then you are losing money and will be bankrupt as soon as those losses eat up the $9,000 in profits you booked the first year. How can you survive? Well if long term rates also go up by a percentage point to 5% you can raise more capital at 2% and lend it out at 5%. Your average profit margins will be smaller in percentage terms but they will be positive instead of zero or negative and your absolute profit will be higher if you can raise more than another million.

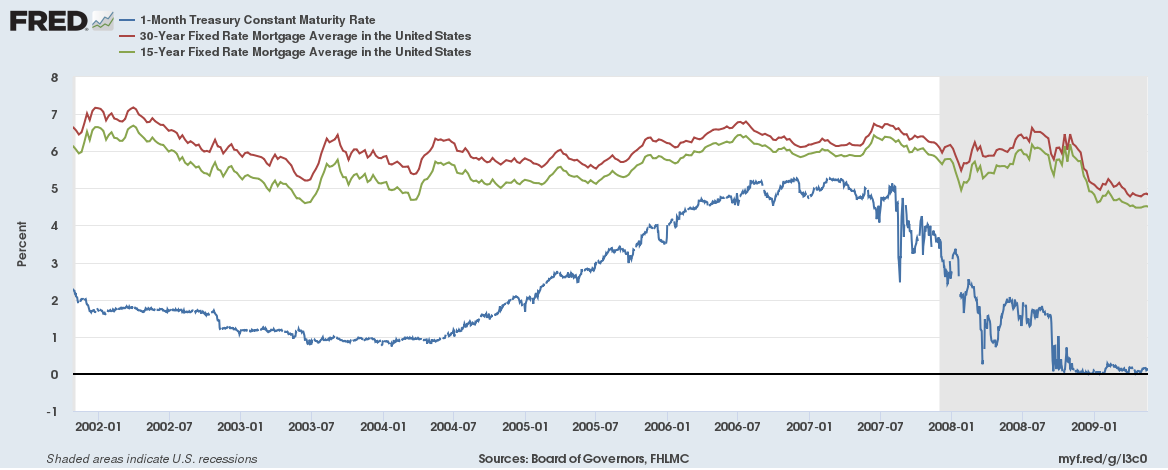
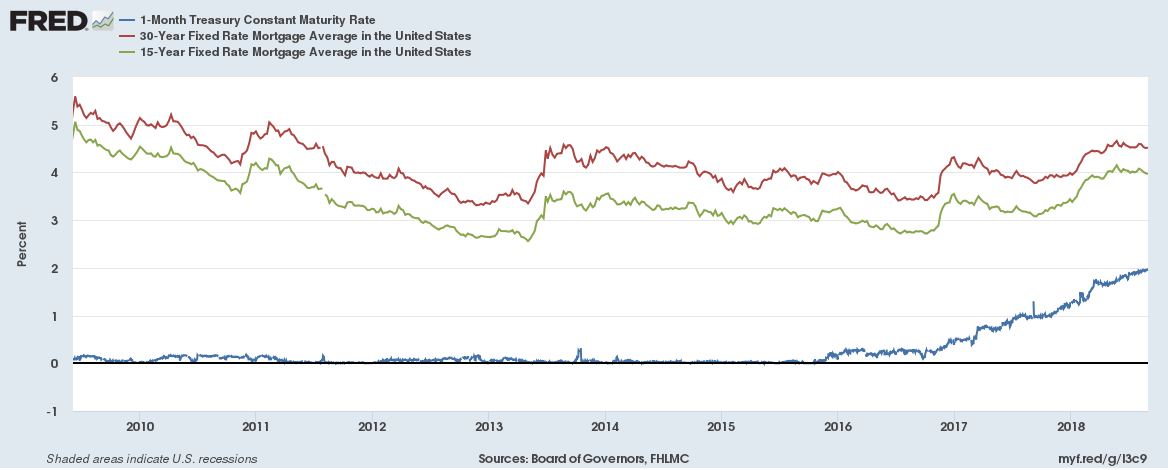
What if long term interest rates don’t lift off with the increase in short term rates? Well you could cut costs or try to increase earnings by betting on riskier investments. Or you could do both, you encourage your loan originators to pump out large numbers of loans and let them cut the quality of the loan recipient to do so. So you have guessed it, I am talking about the housing bubble again. Lets look at short term rates vs long term mortgages shall we?


OK, well 1 month Treasury rates went way up without 15 or 30 year mortgage rates really reacting but perhaps banks borrowing was cheaper?


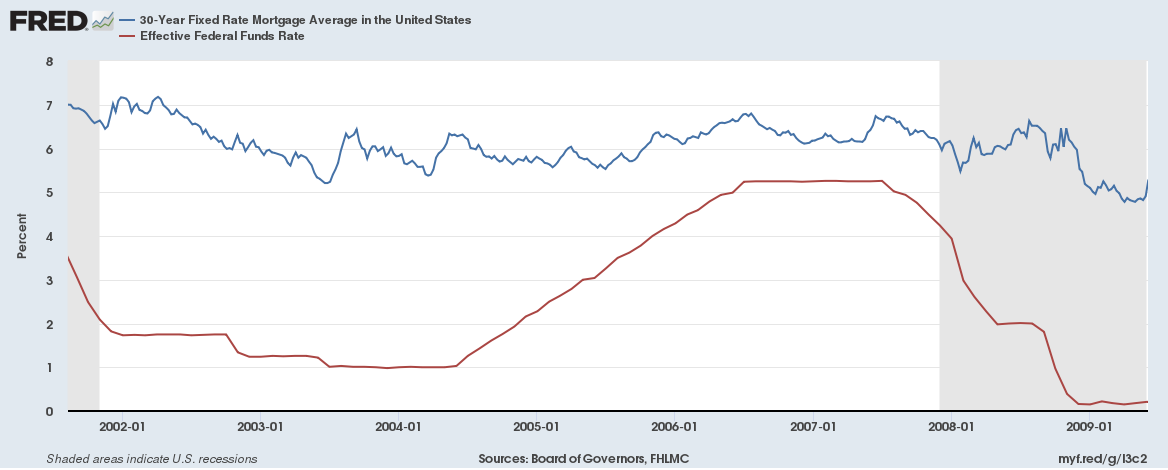
Crap, you could get over 5% on a 3 month CD? What time to be alive… well unless you were a banker. I guess if you were a banker you could borrow from the Fed at low rates until things calmed down, right?


Well crap.


How could this happen though? How could long term rates stay so unfazed when short term rates increased by over 500% in less than 3 years? One partial explanation is that once rates start rising the attempt to maintain profitability means pumping more and more mortgages out the door from your staff (or just an increase in the dollar value of the average loan), basically “increasing” their productivity, and also increasing revenue from the loan origination costs. To loan more however you have to raise more capital so all the banks are competing to draw in more dollars to loan out quickly. You also have to convince people to take the loans out, which means ferocious competition on the mortgage side keeping those rates down.

This doesn’t explain everything, such as why the short term rates increased in the first place, but it fits with a lot of what happened from 2004 through 2008. The effect will be larger or smaller based on the total amount of loans made before the rates started to rise, the larger the amount the more stress on the system. How are things going now?


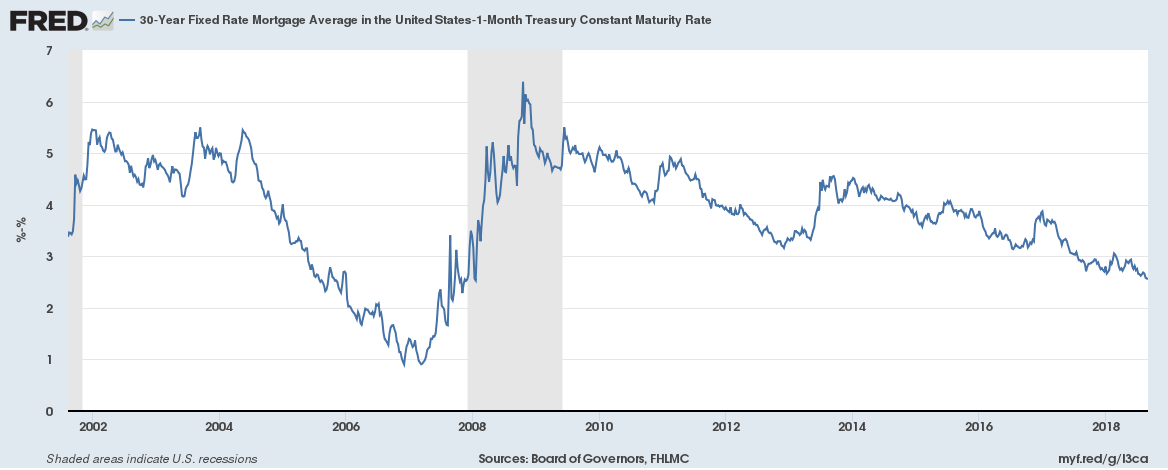
The spread is definitely compressing, here is the 30 year mortgage minus the 1 month Treasury rate


But don’t expect banks to make the exact same mistake twice, it is unlikely that there will be a massive surge in subprime lending this time around. Honestly they aren’t even being pressured to thanks to the Fed’s interest on reserves (IOR) program, which has had its rate pushed up to almost 2% and has basically kept pace with short term borrowing costs allowing banks to carry large amounts of reserves essentially for free recently.

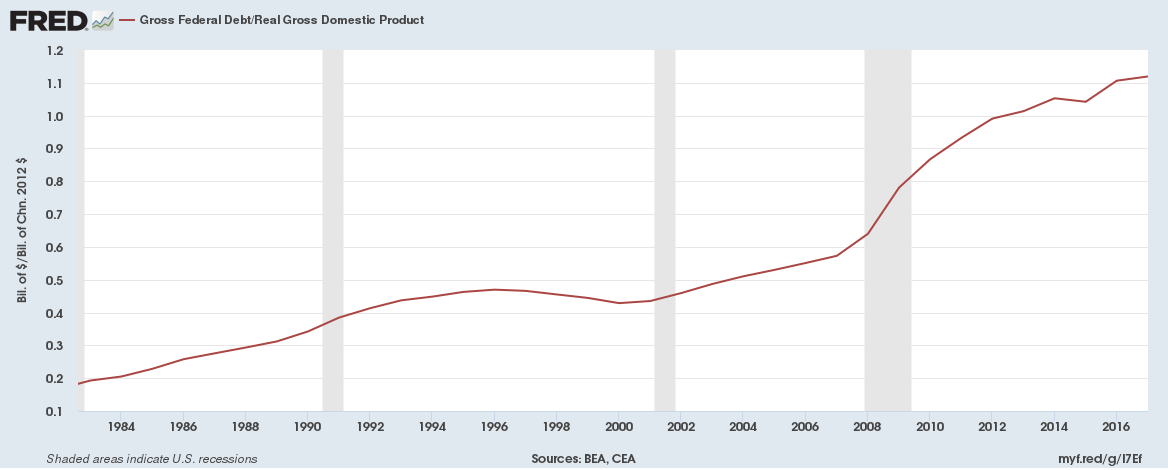
The growth in debt that has been driving interest rate increases recently has been government issued.


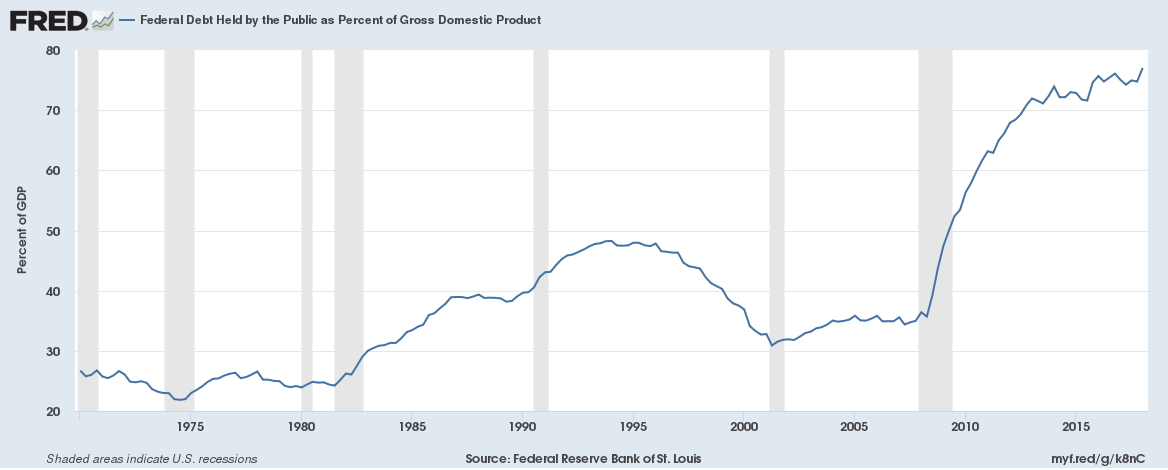
There are three things that are particularly insane about this graph. First that the economy has been at or above full employment and debt to GDP is still increasing (albeit at a much slower rate than from 2008 through 2013), and secondly interest rates have been extremely low pushing the cost of borrowing down for the government and reducing one of its major costs. Thirdly the Federal reserve has been remitting roughly 60 billion dollars more per year post crash than it did pre crash thanks to its earnings.

The sum of these three is significant. The 2001 recession saw tax revenue drop by about 1.5% of GDP and it took until 2005 to exceed revenue from the year 2000 (partly due to tax cuts), the 2008 recession saw revenue drop by about 2.5% of GDP and did not see its 2007 peak exceeded until 2013. A simplistic projection assuming tax receipts in 2007 staying stable vs dropping implies that the crash added 1.2 trillion dollars to the debt due to lower tax receipts alone. This would be more if you compared to the average growth rate of receipts leading into this era. Meanwhile the Fed has remitted around 600 billion dollars more to the Federal government over the last 10 years more than the trend leading into the Great Recession, and interest rates on government debt have been extremely low, had they been merely low (2 percentage points higher) with the same spending+tax rates then debt would be around 2 trillion dollars higher.

The fact that Federal debt levels have risen as a percentage of GDP over the past two years with these tailwinds is concerning, but there are a few points preventing things from getting out of control immediately. First is that only about 60% of the Federal debt comes due in the next 4 years, which means that an interest rate hike of 1 percentage point right now would increase annual debt payments by less than 25 billion (assuming an even distribution of maturing debt over the next 4 years) in the first year, and of around 90 billion by the end of the 4th year.

The second major point is that during a recession the Fed typically ‘stimulates’ by slashing interest rates and increasing its balance sheet which increases remittances, meaning that the Federal government is unlikely to have to fact the trifecta of rising interest rates, lower remittances and lower tax revenues all together.

To be continued.

Thursday, September 20, 2018

Picking up Pennies and the Steamroller

Short term gains don't always translate into long term gains. The obvious example is selling options, you sell a put every year for $1,000, adding a grand in earnings every year right up until the market tanks and you have to pay out a large sum. Some investigations have shown that put sellers make more money off the puts than put buyers do off the large, but sporadic, payouts. However, and to the surprise of many people, how much money you make is only half the game, when you make it also counts for long term investing. Lets take a hypothetical example using some historical data (and some guesses/approximations).

For example I pay $1,000 for a put option on the S&P 500 to you every year on January 1st and you turn around and stick that money in the market. Years one through five the option expires worthless, and then year 6 there is a market crash and I cash out my put for $5,000 and put that $5,000 in the market. The simplistic view is that you are currently ‘up’ $1,000 on me, as I paid you $6,000 and you paid me $5,000 out. A slightly better version is that you are “up” $1,000 plus gains from having that money in the market for 5 years. The correct answer though depends on what happened after I put the money in the market. I got a lump sum that was conditional on the market dropping a substantial amount, and there are certainly times where putting $5,000 in all at once out preforms putting $1,000 in 6 separate chunks.

Following our hypothetical you might have invested $1,000 in Jan 2003 when the S&P was around 900, 2004 at ~1,100, 2005 at 1,200, 2006 at 1250, 2007 at 1,400, and 2008 at 1,450 meaning your average purchase price is (ignoring dividends etc) a little over 1,200. I instead get $5,000 to invest at the end of 2008/early 2009 when the market is around 950. Come 2018 my $5,000 purchase in 2008 is worth a (with the S&P at 2,900) little over $15,000. The $6,000 averaged at 1,200 is worth a little over $14,500.

This shows how buying puts can, potentially, turn a profit even when it "costs" more to buy a series of puts than the total payout because the award was associated with the best market buying opportunity in recent memory.  What about the put seller?  Is he also "up" $15,000 having put none of his own money in play and was just riding off your $6,000 in capital?  Well no, he paid you $5,000 so he can't be up the $15,000, is he up $10,000 then?  Well, no.  He owes you $5,000 in 2009, not in 2018.  So is he up $1,000 compounded from 2009 to 2018?  No again. To get the $5,000 he (to make it simple) sells the exact shares he bought with the $6,000 you paid in yearly installments.  He bought when the S&P was at an average of 1,200 and $6,000 bought him 5 "shares" of the S&P, but he is selling when the market is around 950, and 5 shares of the S&P at 950 sells for $4750.  The other $250 has to come out of his own pocket, so his profit in this example is -$250, even though he got $6,000 for a payout of $5,000.

There are a lot of lessons you could glean from this example, such as don't keep your collateral in the same securities that your obligations are priced in.