Saturday, September 15, 2018
EMH and the Fed, Part 1
The Efficient Market Hypothesis
If someone is going to offer you investing advice (for free or for a price) they are implicitly taking a stance on the Efficient Market Hypothesis (EMH), those suggesting individual actions are taking the con stance and those suggesting low fee mutual funds the pro. Either way it is interesting that so few people argue for or against it with so many financial advisors out there, this is my stance.
The EMH basically states that you can’t consistently outperform the market because any information that would lead you to a better than average decision is going to be incorporated into the price quickly (how quickly and what type of information? Well that is why there are different versions of the EMH). To make a big leap here the fewer people believe in the EMH the more likely it is to be true, and vice versa. To explain a little bit, information only changes prices when individual owners shift their behaviors in response. If Tesla announced that they had produced and sold twice as many cars as they had expected in a quarter you will see people who were thinking of selling pulling their shares off the market, shorts covering their positions and people who doubted Tesla’s long term situation convert and try to buy stock. These are the actions that shift the stock price in the wake of the news.
Imagine a world filled with passive investors, chunks of paychecks are automatically routed to funds to buy shares based on a predetermined algorithm, where no one picked up the phone or logged into their online broker when they read the news, content to sit back and collect dividend payouts from companies. What happens in this world is that stock prices rarely, if ever, move, and the market would be as easy to beat as you could hope for*. Contrast that to a world where every person is scouring source material, reading perspectives, following announcements and building models, this is a world in which gaining an edge is enormously difficult. Why would you even bother trying to beat the market in such a world? Why not just accept average returns and save all the aggravation?
Or to put it another way people who don’t believe in an efficient market are the ones creating the efficient market.
This concept doesn’t apply just to stock markets, a few months ago David Henderson had a post that touched on a related idea where he says “But now consider what happens if people expect, with higher oil prices now, that there will be more production a few years later. Why a few years? Time to drill, time to explore, time to discover. So futures prices a few years hence fall.”
If you take his thought one step further you get to the idea that high oil prices now will cause people to invest in drilling and exploration and lead to lower prices in the future. I really like this example because you can completely bake your noodle imagining causal chains, where noticing that oil production is going to be insufficient in the future causes you to buy futures contracts, which drives the future price up, which causes people to horde oil to sell at that higher price which causes a shortage today. Or buying those contracts pushes up the price, which encourages more marginal exploration and investment which leads to an increased supply and prevents the shortage.
This is the world of markets, where discovering a truth can change it into a falsehood.
Or take Warren Buffett, the richer, more successful and more well known he became the more people picked up copies of “The Intelligent Investor” and tried to apply it’s methods and logic. Naturally those investors are functionally competing with each other, driving up the values of the stocks that are considered undervalued and reducing returns. Rather than turning 1,000 people into the next Warren Buffett the popularity of value investing will prevent the next Warren Buffett from arising in that space.
This is the world of markets, where past performance doesn’t indicate future performance.
This is my view of the EMH in action, it is not that there is no move you can figure out that will beat the market but that figuring it out is the action that will close that window. How quickly the window closes depends on how efficient the market is and how many people noticed it, which is obvious. What is less obvious is that a window can remain open if there is an entity that isn’t profit oriented or capital constrained functionally keeping it open.
*Or perhaps impossible, as every buyer needs a seller.

Friday, September 14, 2018
Causes and/or indicators of recessions
From one point of view every recession looks different. There were deflationary recessions and hyperinflationary recessions which led some to posit that regular old inflation was incompatible with recessions. When their suppositions were proved incorrect we got the term stagflation and a host of new explanations mostly based on what we hadn’t yet seen. After a few more it was near universally agreed that what we definitely hadn’t seen was a broad recession cause by declining housing prices, another example of noticing a truth causing it to be no longer true. So we can have hyperinflation, deflation, stagflation, bubbles in abstract goods (the tech bubble) or solid goods (the housing bubble).
On the other hand, at least recently, recessions seem to have some similarities. The 10 year minus 2 year yield curve (YC) has inverted before each of the last 5 recessions in the US. In each of the last 3 recessions the yield curve reverted before the official beginning of the recession, and each of those events saw market prices reach their absolute peaks after the inversion of the YC.
There are four basic possibilities when two things appear to be strongly correlated, with our example it could be that the recessions was causing the yield curve inversion (unlikely since the inversion occurs first, and sometimes reverts before the recession), it could be that the inversion causes the recession, it could be that both have the same cause or it could just be a coincidence that will disappear in the future (I am disregarding this one for now at my own peril).
So let us take a look at the inverted yield curve. First off it makes no economic sense for the curve to ever invert, because the curve is about lending to the same entity. If the government defaults on its debt in the next two years this will affect both holders of 2 year treasuries and 10 year treasuries, so any risk that is built into the 2 year is built into the 10 year. The 10 year bond can have risk that the 2 year doesn’t, any risk that might rear its head between year 2 and year 10 wouldn’t impact the 2 year return, but would the 10. Likewise opportunity cost favors the 2 year bond, if another, better looking investment opportunity comes along you are more likely to be able to take advantage of it without other costs if you hold a 2 vs a 10 year note.
Functionally you see this in practice. 15 year mortgage rates are lower than 30 year mortgage rates, using FRED data we can see (going back to 1992, when their data starts) that the 15 year rate never exceeds the 30 year rate, this is what you would expect from a reasonably rational market.

This is not an artifact of looking at the longer end of the curve as the 30 year Treasury minus 10 year Treasury was also inverted before each of the last two recessions. This gives us a clue, rates that are (more) market based don’t invert even in the face of major financial issues in the economy. I would say this makes it likely that the cause of YC inversion lies in non market participants, be it the Fed or the Federal government.
Now an inversion could occur one of two ways, either the shorter term rate rises faster than the longer term rate or the longer term rate drops faster than the shorter term rate.
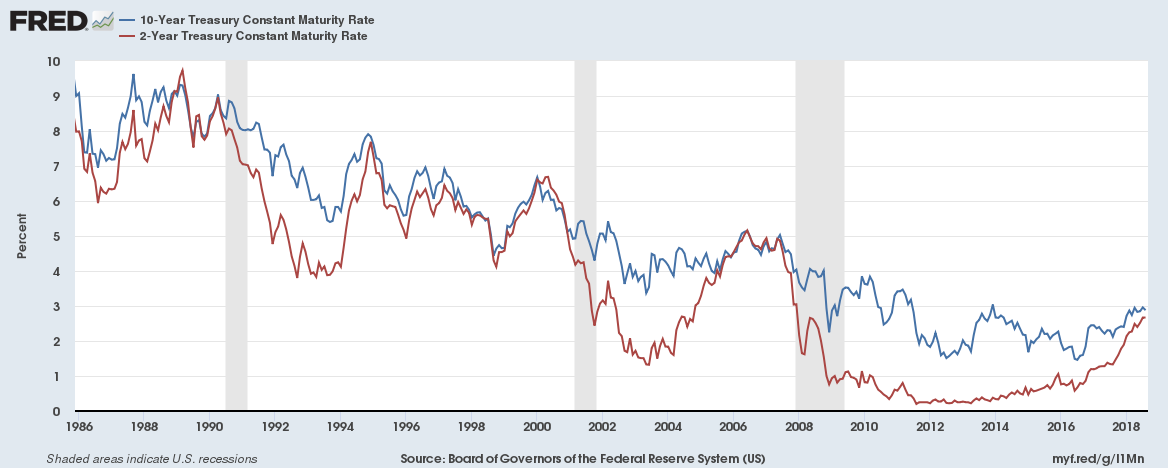
Here we see in each of the last 3 inversions the short rate has risen faster (this is also true for the previous two recessions but the graphs are far harder to read on those longer timescales). It is also true that each time that the YC reverted it did so with the shorter term rate falling faster than the long term rate.
There is in the data set one false positive, with a brief inversion in 1998, this did not shortly preceed a recession. This is also the only one where the inversion came with the long term rate falling faster than the short term rate.
If we take what is generally accepted, that the Federal Reserve controls (or has more influence over) the short end of the curve we have our culprit. We can feel fairly confident of this particularly because the short rate falls to cause the reversion. If the long rate bounced up to cause the reversion it might be that the Fed was simply ahead of the markets sometimes, or some other explanation, given the Fed is basically always raising rates into the inversion followed by lowering I am calling this capitulation by the Fed.
Now we know that the Fed has a dual mandate, full employment and price stability.
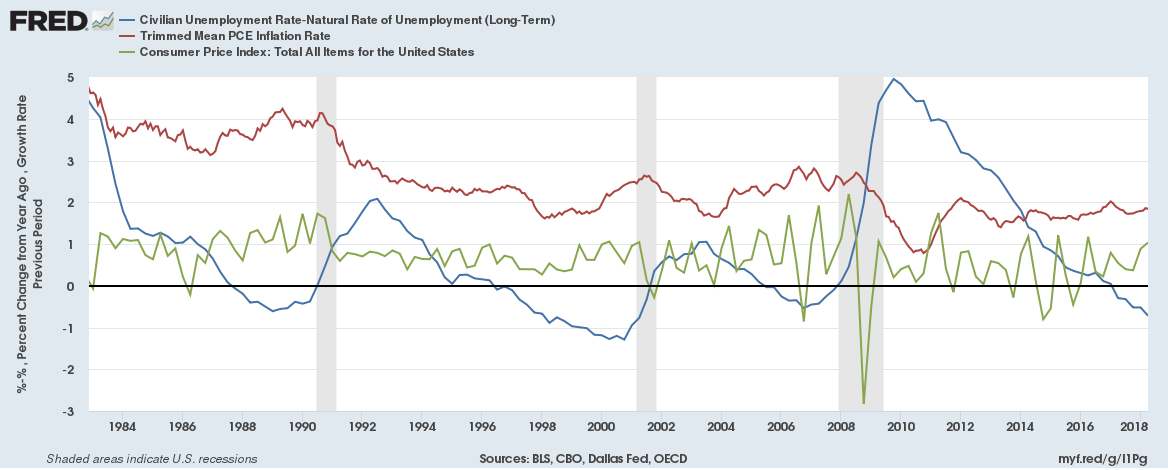
This graph is a little busy, so a brief description is in order. The blue line is the employment rate that the Fed cares about the most, it is the unemployment rate (UE) minus the Natural Rate of unemployment (NRUE), full employment is when this line is at zero, and in an ideal Fed world is where it would always be. The red and green line are different inflation measures.
What I think is of note in this graph is the lack of any inflation driver that would have convinced the Fed to raise rates in any of the events leading up to the inverted yield curve. A couple of better looks with the YC and the inflation measures together.
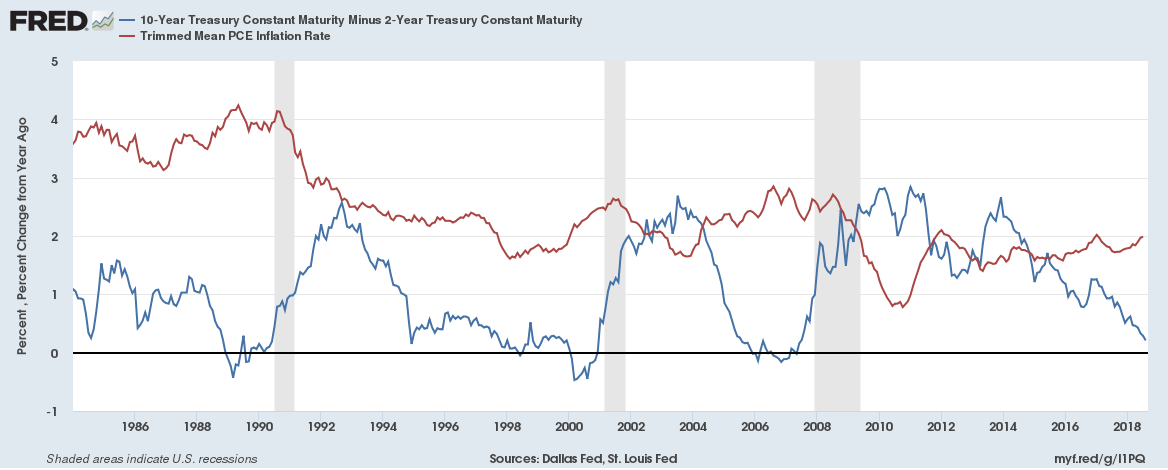

So two final graphs to wrap this portion up
First
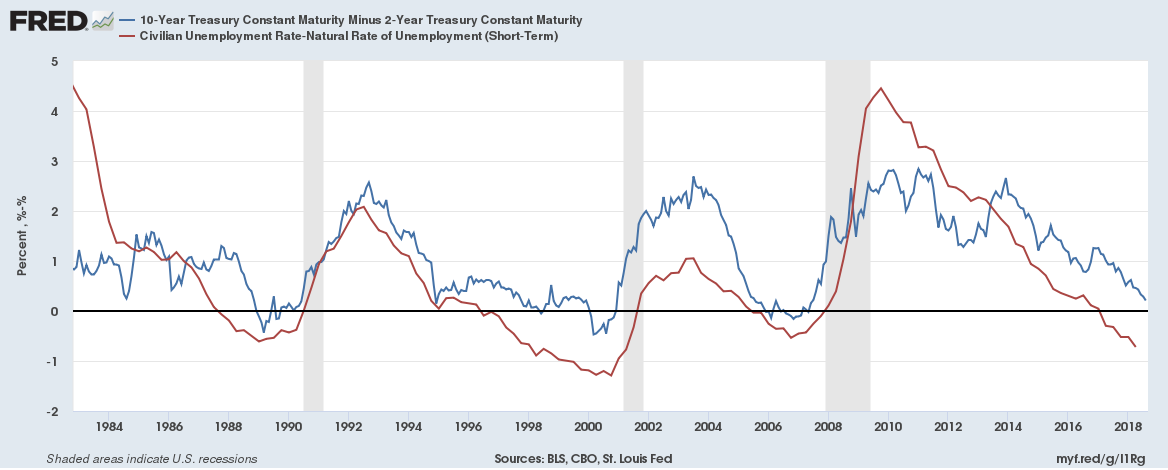
The YC vs UE - NRUE
It appears that UE-NRUE leads the YC into its inversions
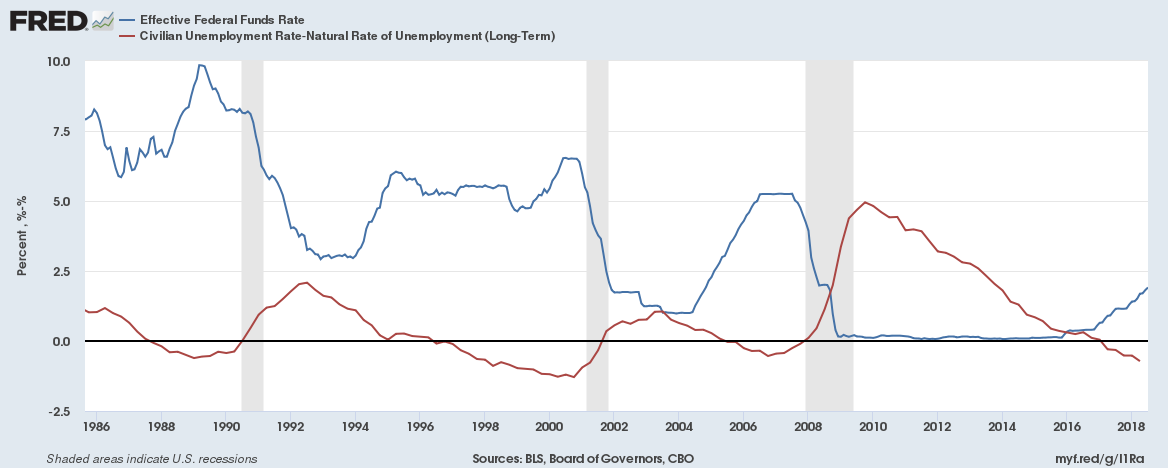
The Federal Funds rate vs UE-NRUE
Here is the interesting stuff. In theory the Fed stimulates the economy by lowering the Federal Funds rate. This is supposed to increase borrowing in turn increasing investment which in turn increases employment. The flip side is also supposedly true, the Fed raises rates to slow down an overheating economy and reduces employment. This graph shows that the opposite is basically occuring. There is a natural objection here, that the Fed reacts to the market and they raise rates when UE is to low already, and lower rates when it gets to high. I do not think this is a satisfactory explanation. In 1989 when the funds rate starts dropping the economy is supposedly above full employment, it doesn’t get to the “ideal” line of full employment until the start of the recession. The same thing occurs in 2000 and 2007, and one interpretation of this is that the Fed’s one measure of a healthy economy doesn’t occur until a recession hits.
Monday, August 7, 2017
Alternatives to Bubbles
There was no housing bubble is, I guess, a new thing going around. It isn't entirely new in that a few people have mentioned it or endorsed it for years, but it is new in the sense of drawing more adherents and tentative supporters these days. Karl Smith via Alex Tabarrok is who I am responding to today. I am going to start with his alternative theory and work backwards a little.
Wonderful! A direct theory we can talk about without having to infer what was really meant and end up arguing past each other because of a lack of common ground. So my first major objection is
That rise is significant because the two markets (housing and stock) diverged in momentum. Housing peaked and then drifted sideways and a little down while stocks pushed quite a bit higher, it is unlikely that the two markets were responding to a single cause. In fact if you were to oversimplify and offer two alternate explanations in this way
1. The recession drove money out of the housing market and caused the decline
2. The housing decline caused the recession
#1 is almost certainly false. This is a major, but not fatal*, blow to the proposed theory. There are logical holes in several other steps in this post along the way. Another here
Followed by
Housing has been a terrible investment for people who bought between 2000 and 2010 in opportunity cost terms. Note this line
This is wrong on two levels. First housing prices from 2007-2017 failed to keep pace with inflation, it is not assured that a higher inflation rate would have caused a faster rise in nominal home prices. Secondly the higher inflation rate could well have meant (and probably would have meant) larger real losses for the homeowners.
I understand that the argument stems from a simplified view of the housing bubble, but Smith here is using slight of hand to waive away the costs. Yes if someone held onto their house they probably could have eventually sold it and not taken a nominal loss, and fully repaying their mortgage a decade or so later. However this is just shifting the losses that investors took on the securities and shifting them onto the homeowners. The fact that 10 years later homeowners are still realizing real losses (and not just opportunity cost losses which are much larger, simple inflation adjusted losses), and eyeballing the trend line from the 2012 trough it would be reasonable to expect at least another 4-5 years before those real losses hit zero, is a major point of strength for the housing bubble side.
* It has been noted by some that the housing price fall was fairly modest up through August 2008 and fell aggressively as the financial crisis unfolded, which allows for a theory along the lines of "the decline in housing wasn't enough to start the recession, but the crisis was enough to drive housing far lower". I find this unconvincing as the financial crisis was actually initiated by investors demanding that additional collateral be put up by major institutions (along with some actual fraud), which is a direct way of saying that the market was anticipating a greater chance of a failed repayment than it had done in the recent past. It is hard for me to believe that recession is the direct cause of the housing decline when the most important events for the housing decline preceded the corresponding portions of the recession.
Let me then tie all this together by advancing a theory: there was no bubble in either housing or commercial real estate. There was, however, a massive increase in liquidity driven by financial innovation in the late 1990s and early 2000s. That increase in liquidity allowed real estate markets to behave more like stock or commodity markets. In good time, prices would rise rapidly as money poured into capital markets. During recessions, prices would retreat as money retreated to safer havens.
Wonderful! A direct theory we can talk about without having to infer what was really meant and end up arguing past each other because of a lack of common ground. So my first major objection is
During recessions, prices would retreat as money retreated to safer havens.A prediction. Now Karl Smith includes in his post graphs of home prices, both real an nominal (another wonderful thing to include) covering the 'bubble' and recovery, so we can check to see if this is an accurate description of what happened. The short answer is no, it isn't. The graphs show nominal housing prices peaked in July 2006, and real housing prices peaked in December 2005, so real prices peaked almost 2 years prior to the start of the recession and about 20 months prior to the stock markets as the S&P peaked in October 2007. Importantly the S&P didn't just peak a year to a year and a half later, it rose significantly during that period, from the 1260-1270 range in late 2005 to peak of over 1550 in October, more than a 20% rise no matter what you look at (peak to peak, moving averages, whatever).
That rise is significant because the two markets (housing and stock) diverged in momentum. Housing peaked and then drifted sideways and a little down while stocks pushed quite a bit higher, it is unlikely that the two markets were responding to a single cause. In fact if you were to oversimplify and offer two alternate explanations in this way
1. The recession drove money out of the housing market and caused the decline
2. The housing decline caused the recession
#1 is almost certainly false. This is a major, but not fatal*, blow to the proposed theory. There are logical holes in several other steps in this post along the way. Another here
As mentioned, nominal values have rebounded strongly over the past six years, despite a weak economy, increased financial regulation, and a backlog of foreclosures. This rise in nominal values is key because it is tied to the viability of mortgage contracts. Suppose homebuyers in 2007 had gotten caught up in bubble fever, taken on a mortgage that was a bit too much for them to afford, and then watched the value of their investment collapse. Well, if they could have ridden the wave out for 10 years, then they could have gotten back out at least what they put in. Ten years is a long time, and according to the NAHB, it’s a bit less than how long the median homeowner stayed put through the 90s and early 2000s.
Followed by
Riding the bust out would have been tough, but not wildly out of the ordinary for the average homebuyer. Yet, it only took this long because inflation has been extraordinarily low, rarely rising to two percent a year. A faster rate of inflation would have brought homeowners out of the dip even sooner.Why is Kevin Smith choosing nominal instead of real here? Yes there is an intuition that if nominal prices rebound you can sell the house and get out from under your obligation but the real loss still exists. In terms of opportunity costs if you held onto your house by selling stocks and bonds during this period or by not buying stocks and bonds while plowing money into your mortgage payments then you missed what has been a major run up in other markets. Even if your choice was literally to sell the S&P at its absolute peak in 2007 to maintain your mortgage payments you have forgone a roughly 60% nominal increase on that money.
Housing has been a terrible investment for people who bought between 2000 and 2010 in opportunity cost terms. Note this line
A faster rate of inflation would have brought homeowners out of the dip even sooner.
This is wrong on two levels. First housing prices from 2007-2017 failed to keep pace with inflation, it is not assured that a higher inflation rate would have caused a faster rise in nominal home prices. Secondly the higher inflation rate could well have meant (and probably would have meant) larger real losses for the homeowners.
I understand that the argument stems from a simplified view of the housing bubble, but Smith here is using slight of hand to waive away the costs. Yes if someone held onto their house they probably could have eventually sold it and not taken a nominal loss, and fully repaying their mortgage a decade or so later. However this is just shifting the losses that investors took on the securities and shifting them onto the homeowners. The fact that 10 years later homeowners are still realizing real losses (and not just opportunity cost losses which are much larger, simple inflation adjusted losses), and eyeballing the trend line from the 2012 trough it would be reasonable to expect at least another 4-5 years before those real losses hit zero, is a major point of strength for the housing bubble side.
Buying into a bubble suggests that you are paying irrationally high prices that are premised only on the notion of “some-greater-fool” coming along and rescuing from your mistake. As we can see that is not the case.This statement only makes sense if you assume that those who held onto their house could do so at no cost. The bigger fool in this case is the fool who held onto his house for 10 years so that he could then sell it at no gain, rather than invest more profitably in virtually any other asset class over that period.
* It has been noted by some that the housing price fall was fairly modest up through August 2008 and fell aggressively as the financial crisis unfolded, which allows for a theory along the lines of "the decline in housing wasn't enough to start the recession, but the crisis was enough to drive housing far lower". I find this unconvincing as the financial crisis was actually initiated by investors demanding that additional collateral be put up by major institutions (along with some actual fraud), which is a direct way of saying that the market was anticipating a greater chance of a failed repayment than it had done in the recent past. It is hard for me to believe that recession is the direct cause of the housing decline when the most important events for the housing decline preceded the corresponding portions of the recession.
Friday, July 7, 2017
Risk Neutral
An expansion on some thoughts in response to a comment by Kevin Erdman on Arnold Kling's blog.
Kevin highlight's a point about risk which is valuable, that people who buy debt (ie bonds) are generally risk averse and people who buy equity (ie stocks) are generally risk tolerant. The conclusion though is incorrect because he looks only at the buyers, and not the sellers of the assets. If buying bonds is risk aversion then selling bonds should be seen as risk tolerance, with the opposite relationship for equity, let's look at both how this is true and the implications.
First why are bonds less risky than equity? First it is because they (typically) have a claim on the underlying capital. If you buy equity in Ford and they go belly up then your equity will be wiped out. If you buy debt from ford and they go belly up your debt will be converted to equity and you are now a proud new owner of a fraction of Ford's physical capital, their manufacturing plants, their patents, and anything else worth selling or using. So you have this natural buffer where even if the overall business fails there is some value to be extracted from the ruins, which an equity holder doesn't have. Secondly it takes a much larger blow to the company to decrease the coupon payments. A decline in sales will take a whack at the equity, and the market value of bonds, but the actual income stream won't be effected until the blow is large enough to interrupt the coupon payments.
That is from the investor's perspective, now from the companies perspective this is reversed. When a company sells equity they give up a ownership stake in exchange for cash, if the stock price falls afterwards the company doesn't have to give part of that cash back. A stock issuance is low risk from the companies perspective, the total market capitalization could fall to a single penny and they don't have to repay a cent of it, the investor takes on all of that risk. Now a bond issuance, they borrow money and promise to pay it back with the company assets as collateral. If they cannot make the payments the entire company is potentially forfeit. Any risk that the investor is insulated from must be passed on to the company.
This inverse relationship is pretty straightforward. If Ford wants to build a new assembly line they can fund it through debt or equity, but funding from one or the other doesn't (shouldn't) alter the risk inherent in that capital expenditure, what funding from one or the other does is shift the risk and reward profile. If they issue through debt and it is a huge success the bondholders get their coupon payments and Ford gets all the upside of a major and profitable investment. If they fund through equity the shareholders get the upside of that profit stream. If it is a failure Ford has risked the company's assets and will have to sell them off to make their bondholders whole. If it fails and they have funded through equity the share holders take the (majority of the) loss, and the company retains all its other assets.
In a perfect world/market these things balance out perfectly every time. Total risk is constant, and distribution of risk is matched with compensation for exposure to it. Where it is a problem is when one group can offload risk onto a third party without compensation.
Wednesday, December 7, 2016
When aren't they efficient?
The approach to markets, especially betting markets, supposes that they are efficient or trending towards efficiency. There is a specific circumstance where markets no longer trend toward efficiency, that is basically never discussed.
Walk into a convince store, look at the dozen drinks on display. How many individual choices are there? Not 12, but 13. 1 for each drink, and 1 for not purchasing a drink at all. Take 130 people, each day each of the dozen drinks gets bought 10 times, and 10 times the "no purchase" is exercised.
10 people day after day are not buying drinks. If they are $1 each then after a year you have 10 people with $365 that they are willing to use on drinks if there was one they liked. This (potentially) opens up a brand new niche in the market, as the daily savings allows for a new product to enter the market. One day on the shelves a specialty drink will appear, aimed at satisfying this segment. Perhaps it will be priced at $2, perhaps $20.
Strip away the savings, instead of a dollar spent every time, give each of the 130 people a coupon for 1 drink that expires at the end of each day. Now there is no build up of savings and so no incentive to create a more expensive drink for those with particular (or peculiar) tastes.
This is the major flaw in electoral "markets", votes can't be rolled over in anticipation of a better candidate 2, 4 or 40 years down the line. Marginalized groups tend to stay marginalized and powerful groups powerful thanks to the absence of this mechanism.
Now we are potentially living in an even more dangerous time. Financial markets have become so entangled that there is no fundamental way to "save" outside of it. Sell stocks because you are worried about the economy? What are you going to do with the cash? The solvency of banks is directly tied to the solvency of the US Treasury, which is tied back to the strength of the economy.
Whenever someone makes the following mistake, "markets aren't worried about default because if they were interest rates on government debt would be higher" simply ask them this "Where should I put my money if I am afraid of a government default in my country?".
Sunday, October 9, 2016
People don't appreciate scale
Marginal Revolution links to a Minimum Garaunteed job proposal, that is incredibly naive.
The US labor force is currently around 160 million people, with a 5% UE rate some 8 million people are going to be eligible for this work, assuming only 1 in 10 decides to take the government up on the offer and assuming that zero people out of the labor force get pulled back in the Federal Government will be providing jobs for 800,000 people at any one time. Of course the "safety net" is most important during times of trouble, during the last recession the UE rate peaked near 10%, to provide jobs during a period like that would result in the government running an industry of 1.6 million people. Wal-Mart is the largest employer in the US and has fewer than 1.5 million employees here.
Of course the honor system doesn't work so you need to have people oversee these activities, and managers to organize and watch the overseers (and again and again), along with payroll, legal departments (for when someone claims repetitive stress disorders from doing to prescribed activities), HR departments so people can complain that their website is down/they didn't get paid/their disabilities aren't catered to, coders on the front and back end of websites and all manner of other positions.
It is basically inevitable that this program, if it was at all successful, would become the single largest employer of people in the US, its "employees" will almost certainly agitate to form a union at some point (with some bizarre potential complications) and all of this is going to have to be designed in a way to double in size within a few months during a recession.
The most obvious blind spot in politics these days is that the sheer size of proposed solutions are generally brushed aside. I mean if Wal-Mart can build a labor force of 1.5 million over decades, then surely the government can build something even bigger with a few pen strokes, a few good intentions and a 5 page proposal outlining the finer points.
The guaranteed job will consist of a variety of mental and physical tasks that can be easily monitored either online or within existing institutions. The mental tasks might be activities such as keyboarding practice, doing arithmetic exercises on an internet training program, doing exercises in word processing, doing spread sheets, reading reports and summarizing them, or completing online courses. The physical tasks might include doing specific exercises, digging holes and filling them, moving weights, and other similar type activities. The goal of these activities is not to produce usable output for society, but to provide work activities by which people can translate their time into income. To the degree possible, these working experiences will provide training in skills and an introduction to customs and behavior useful in the real-world market jobs
The US labor force is currently around 160 million people, with a 5% UE rate some 8 million people are going to be eligible for this work, assuming only 1 in 10 decides to take the government up on the offer and assuming that zero people out of the labor force get pulled back in the Federal Government will be providing jobs for 800,000 people at any one time. Of course the "safety net" is most important during times of trouble, during the last recession the UE rate peaked near 10%, to provide jobs during a period like that would result in the government running an industry of 1.6 million people. Wal-Mart is the largest employer in the US and has fewer than 1.5 million employees here.
Of course the honor system doesn't work so you need to have people oversee these activities, and managers to organize and watch the overseers (and again and again), along with payroll, legal departments (for when someone claims repetitive stress disorders from doing to prescribed activities), HR departments so people can complain that their website is down/they didn't get paid/their disabilities aren't catered to, coders on the front and back end of websites and all manner of other positions.
It is basically inevitable that this program, if it was at all successful, would become the single largest employer of people in the US, its "employees" will almost certainly agitate to form a union at some point (with some bizarre potential complications) and all of this is going to have to be designed in a way to double in size within a few months during a recession.
The most obvious blind spot in politics these days is that the sheer size of proposed solutions are generally brushed aside. I mean if Wal-Mart can build a labor force of 1.5 million over decades, then surely the government can build something even bigger with a few pen strokes, a few good intentions and a 5 page proposal outlining the finer points.
Wednesday, September 21, 2016
Self driving cars and PSST
Arnold Kling thinks that self driving cars will push people away from car ownership almost entirely, and underesitmates the complexity of car ownership.
He does, to his credit, say "if", but the reliable and affordable are never going to be affordable enough. Kling's view of the economy is summed up by his description of Patterns of Sustainable Specialization and Trade (PSST), whereby complex relationships are constantly trying to find an equilibrium, he would be good to think of the complex relationships Americans (in particular) have with their cars, and how that could be replicated in the real world.
First off lots of people customize their cars, and I am not talking about rims and paint jobs. One of our cars has two kids seats in it, with straps adjusted to their sizes, a collapsible stroller in the trunk along with a fair amount of dirt, bits of snacks wedged into the seats, and various toys and children's books scattered about. For a ride sharing company to meet my individual demand for a car they are going to need at the ready a car with two kids seats of the right size near my house, not have a passenger shortly after me allergic to peanuts, and not care or charge for cleaning out dog hair, mulch or topsoil. I may be unusual in the specific things that I do with my car, but I am hardly unusual in that I do specific things with my car.
The second problem is one of use patterns. The issue with rentals of any kind is that there is always a peak load that needs to be filled. Hotels are expensive not because it costs $36,500 ($100 a night) a year to build, rent, maintain and profit off a single hotel room but because most nights hotel rooms sit empty, and then a handful of times a year they are packed to the brim. It is a fact of life that the times that you want to use X are usually the times lots of other people want to use X. For the majority of people to use Uber or Lyft instead of their own cars their fleets will have to be large enough to accommodate the peak load on roads, you know, rush hour. Not only will they have to be big enough to handle the average load, but they will also need to be big enough to handle the worst traffic days when an accident, breakdown or construction doubles commute times, and all the 9 am traffic who, theoretically, would be riding around in cars that the 8 am traffic used is suddenly stranded and running an hour late.
Lastly fully automated autos are going to reduce a lot of the non financial costs of driving. The boredom of sitting in traffic will be replaced by entertainment, the discomfort many feel sitting in car seats can be replaced with better designs now that the steering wheel is out of the way, and the safety risks of driving should be mitigated. An economist should expected that self driving cars will reduce the costs of driving, and so should increase the incidence of driving. This should mean people get more use and value out of owning their individual car(s), which will push back heavily against corporate ownership.
If Uber and Lyft are reliable and affordable, then you do not need to own a car.
He does, to his credit, say "if", but the reliable and affordable are never going to be affordable enough. Kling's view of the economy is summed up by his description of Patterns of Sustainable Specialization and Trade (PSST), whereby complex relationships are constantly trying to find an equilibrium, he would be good to think of the complex relationships Americans (in particular) have with their cars, and how that could be replicated in the real world.
First off lots of people customize their cars, and I am not talking about rims and paint jobs. One of our cars has two kids seats in it, with straps adjusted to their sizes, a collapsible stroller in the trunk along with a fair amount of dirt, bits of snacks wedged into the seats, and various toys and children's books scattered about. For a ride sharing company to meet my individual demand for a car they are going to need at the ready a car with two kids seats of the right size near my house, not have a passenger shortly after me allergic to peanuts, and not care or charge for cleaning out dog hair, mulch or topsoil. I may be unusual in the specific things that I do with my car, but I am hardly unusual in that I do specific things with my car.
The second problem is one of use patterns. The issue with rentals of any kind is that there is always a peak load that needs to be filled. Hotels are expensive not because it costs $36,500 ($100 a night) a year to build, rent, maintain and profit off a single hotel room but because most nights hotel rooms sit empty, and then a handful of times a year they are packed to the brim. It is a fact of life that the times that you want to use X are usually the times lots of other people want to use X. For the majority of people to use Uber or Lyft instead of their own cars their fleets will have to be large enough to accommodate the peak load on roads, you know, rush hour. Not only will they have to be big enough to handle the average load, but they will also need to be big enough to handle the worst traffic days when an accident, breakdown or construction doubles commute times, and all the 9 am traffic who, theoretically, would be riding around in cars that the 8 am traffic used is suddenly stranded and running an hour late.
Lastly fully automated autos are going to reduce a lot of the non financial costs of driving. The boredom of sitting in traffic will be replaced by entertainment, the discomfort many feel sitting in car seats can be replaced with better designs now that the steering wheel is out of the way, and the safety risks of driving should be mitigated. An economist should expected that self driving cars will reduce the costs of driving, and so should increase the incidence of driving. This should mean people get more use and value out of owning their individual car(s), which will push back heavily against corporate ownership.
Subscribe to:
Posts (Atom)